
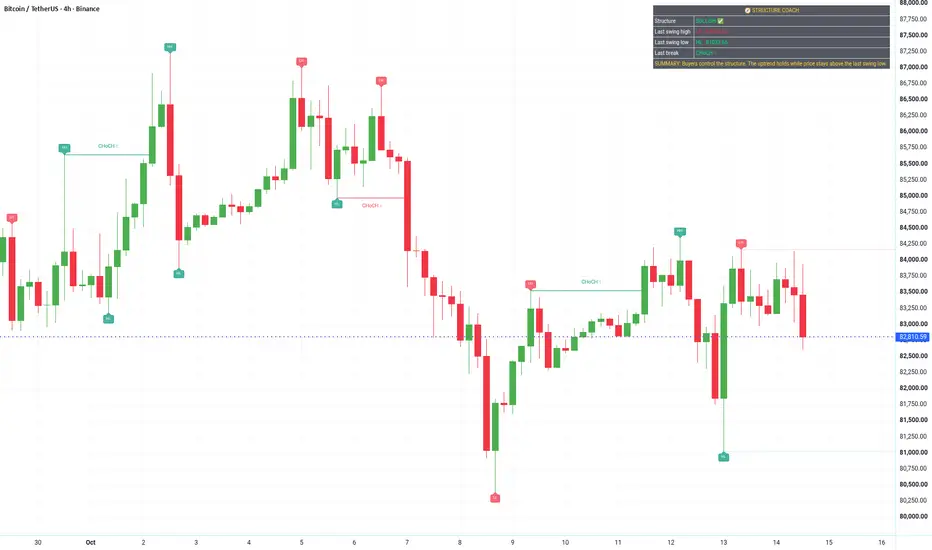
Market structure is the simplest way to read a trend: a series of swing highs and swing lows. This chart uses Market Structure Coach on BTCUSDT 4H to show how a downtrend can start to change character, and what would confirm or cancel that change.
What happened
1. From Oct 5 to Oct 8, BTC printed lower highs (about 87,000, then 86,700) and lower lows, down to about 80,400 on Oct 8. That is bearish structure.
2. On Oct 11 and 12, price pushed above the Oct 9 swing high near 83,530 and reached about 84,350. Breaking the last lower high is the first sign that bearish structure is being challenged, often called a change of character.
3. The pullback on Oct 12 and 13 held near 81,000, above the 80,400 low. That is a higher low.
4. Since then, the 84,000 to 84,350 area has capped price several times (Oct 11, 12, 13 and 14). Price is now back inside the range, around 82,900.
How to read it
- A broken lower high plus a higher low is an early shift, not a confirmed uptrend. Confirmation would be a 4H close above the 84,350 ceiling, creating a higher high (a break of structure).
- If price instead closes below the 81,000 higher low, the shift fails and the bearish structure from early October is back in control.
- Between these two levels the market is ranging. Ranges often produce false breaks, so many traders wait for a candle close rather than reacting to a wick.
Lesson takeaway
Do not label a trend from one candle. Mark the last swing high and the last swing low, and let price show you which one breaks first.
Educational content only, not financial advice.
What happened
1. From Oct 5 to Oct 8, BTC printed lower highs (about 87,000, then 86,700) and lower lows, down to about 80,400 on Oct 8. That is bearish structure.
2. On Oct 11 and 12, price pushed above the Oct 9 swing high near 83,530 and reached about 84,350. Breaking the last lower high is the first sign that bearish structure is being challenged, often called a change of character.
3. The pullback on Oct 12 and 13 held near 81,000, above the 80,400 low. That is a higher low.
4. Since then, the 84,000 to 84,350 area has capped price several times (Oct 11, 12, 13 and 14). Price is now back inside the range, around 82,900.
How to read it
- A broken lower high plus a higher low is an early shift, not a confirmed uptrend. Confirmation would be a 4H close above the 84,350 ceiling, creating a higher high (a break of structure).
- If price instead closes below the 81,000 higher low, the shift fails and the bearish structure from early October is back in control.
- Between these two levels the market is ranging. Ranges often produce false breaks, so many traders wait for a candle close rather than reacting to a wick.
Lesson takeaway
Do not label a trend from one candle. Mark the last swing high and the last swing low, and let price show you which one breaks first.
Educational content only, not financial advice.

إخلاء المسؤولية
لا يُقصد بالمعلومات والمنشورات أن تكون، أو تشكل، أي نصيحة مالية أو استثمارية أو تجارية أو أنواع أخرى من النصائح أو التوصيات المقدمة أو المعتمدة من TradingView. اقرأ المزيد في شروط الاستخدام.
إخلاء المسؤولية
لا يُقصد بالمعلومات والمنشورات أن تكون، أو تشكل، أي نصيحة مالية أو استثمارية أو تجارية أو أنواع أخرى من النصائح أو التوصيات المقدمة أو المعتمدة من TradingView. اقرأ المزيد في شروط الاستخدام.