
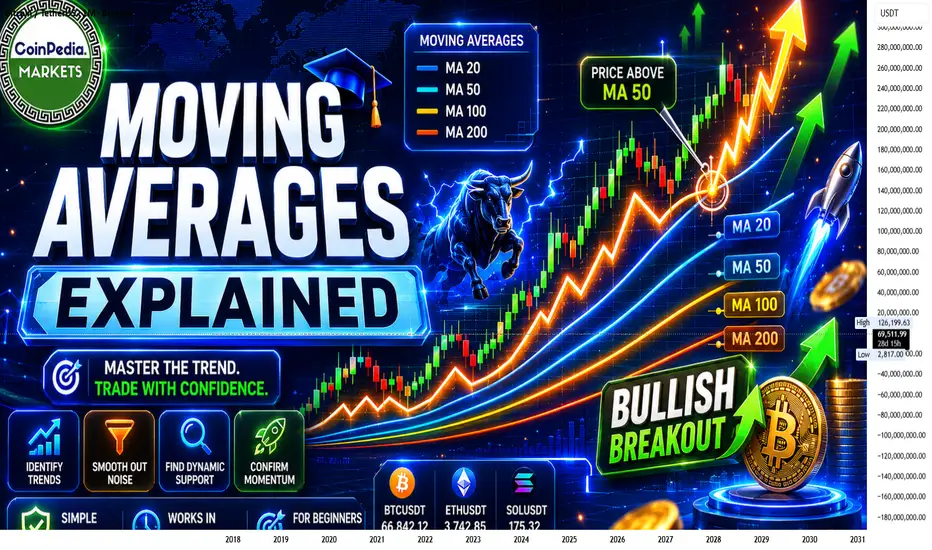
Moving Averages are one of the most widely used indicators in trading. They help traders identify the **trend direction**, **dynamic support/resistance**, and potential **entry and exit points** by smoothing out price fluctuations.
Think of a Moving Average as a line that shows the "average price" over a specific number of periods.
---
## Why Traders Use Moving Averages
Price is noisy.
A chart can move up and down aggressively even while the overall trend remains bullish.
Moving averages filter out this noise and help answer:
✅ Is the trend up or down?
✅ Is momentum strengthening or weakening?
✅ Where might support or resistance appear?
✅ Is a trend changing?
---
# Types of Moving Averages
## 1. Simple Moving Average (SMA)
The SMA calculates the average closing price over a set period.
Example:
A 10-day SMA adds the last 10 closing prices and divides by 10.
Formula:
SMA=\frac{P_1+P_2+...+P_n}{n}
### Characteristics
* Smooth
* Slower to react
* Good for identifying major trends
Common SMAs:
* 20 SMA
* 50 SMA
* 100 SMA
* 200 SMA
---
## 2. Exponential Moving Average (EMA)
The EMA gives more weight to recent prices.
This makes it react faster than an SMA.
### Characteristics
* Faster signals
* Better for short-term trading
* More sensitive to momentum shifts
Popular EMAs:
* 9 EMA
* 20 EMA
* 50 EMA
* 200 EMA
Most crypto traders prefer EMAs because crypto moves quickly.
---
# Most Important Moving Averages
## 9 EMA
Used by:
* Scalpers
* Day traders
Purpose:
* Tracks short-term momentum
* Fast trend changes
Price above 9 EMA:
📈 Short-term bullish
Price below 9 EMA:
📉 Short-term bearish
---
## 20 EMA
One of the most popular crypto MAs.
Acts as:
* Trend filter
* Dynamic support
* Dynamic resistance
Strong trends often bounce repeatedly from the 20 EMA.
---
## 50 EMA
Represents the medium-term trend.
Institutional traders watch it closely.
Bullish:
Price above 50 EMA
Bearish:
Price below 50 EMA
---
## 200 EMA
The king of moving averages.
Used to identify long-term trend direction.
Bull Market:
Price above 200 EMA
Bear Market:
Price below 200 EMA
---
# Moving Average Crossovers
One MA crossing another often signals a trend shift.
## Golden Cross 🟢
Occurs when:
50 MA crosses ABOVE 200 MA
Bullish signal.
Suggests long-term strength.
---
## Death Cross 🔴
Occurs when:
50 MA crosses BELOW 200 MA
Bearish signal.
Suggests long-term weakness.
---
# Dynamic Support and Resistance
Moving averages often act like invisible support and resistance levels.
Example:
In an uptrend:
* Price pulls back
* Touches 20 EMA
* Buyers step in
* Trend continues
This is called a "trend continuation bounce."
---
# Moving Average Stacking
The strongest trends occur when multiple MAs align.
### Bullish Stack
9 EMA > 20 EMA > 50 EMA > 200 EMA
This shows:
* Strong momentum
* Strong trend
* Strong buyer control
---
### Bearish Stack
9 EMA < 20 EMA < 50 EMA < 200 EMA
This shows:
* Weakness
* Strong selling pressure
* Bearish trend
---
# How Crypto Traders Use Moving Averages
### Trend Trading
Only buy when:
* Price above 50 EMA
* Price above 200 EMA
---
### Pullback Entries
Wait for:
* Uptrend
* Pullback into 20 EMA
* Bullish reaction candle
Enter after confirmation.
---
### Breakout Confirmation
A breakout is stronger when:
* Price breaks resistance
* Price closes above key EMAs
* Volume increases
---
# Common Mistakes
❌ Using only one MA
❌ Trading every crossover
❌ Ignoring volume
❌ Ignoring market structure
❌ Using MAs during choppy markets
Moving averages work best in trending markets.
---
# Best MA Setup for Crypto
### Beginners
* 20 EMA
* 50 EMA
* 200 EMA
### Swing Traders
* 20 EMA
* 50 EMA
* 100 EMA
* 200 EMA
### Scalpers
* 9 EMA
* 20 EMA
* 50 EMA
---
# Professional Trader Perspective
Moving averages should not be used alone.
The best traders combine them with:
* Market Structure
* Support & Resistance
* Volume
* Liquidity Zones
* Trendlines
* Fibonacci Levels
Moving averages are not prediction tools. They are **trend-following tools** that help traders stay on the right side of the market.
### Simple Rule
📈 Price above 200 EMA = Look for longs.
📉 Price below 200 EMA = Be cautious with longs and favor shorts.
That's why you'll find the 20 EMA, 50 EMA, and 200 EMA on almost every professional trader's chart.
Think of a Moving Average as a line that shows the "average price" over a specific number of periods.
---
## Why Traders Use Moving Averages
Price is noisy.
A chart can move up and down aggressively even while the overall trend remains bullish.
Moving averages filter out this noise and help answer:
✅ Is the trend up or down?
✅ Is momentum strengthening or weakening?
✅ Where might support or resistance appear?
✅ Is a trend changing?
---
# Types of Moving Averages
## 1. Simple Moving Average (SMA)
The SMA calculates the average closing price over a set period.
Example:
A 10-day SMA adds the last 10 closing prices and divides by 10.
Formula:
SMA=\frac{P_1+P_2+...+P_n}{n}
### Characteristics
* Smooth
* Slower to react
* Good for identifying major trends
Common SMAs:
* 20 SMA
* 50 SMA
* 100 SMA
* 200 SMA
---
## 2. Exponential Moving Average (EMA)
The EMA gives more weight to recent prices.
This makes it react faster than an SMA.
### Characteristics
* Faster signals
* Better for short-term trading
* More sensitive to momentum shifts
Popular EMAs:
* 9 EMA
* 20 EMA
* 50 EMA
* 200 EMA
Most crypto traders prefer EMAs because crypto moves quickly.
---
# Most Important Moving Averages
## 9 EMA
Used by:
* Scalpers
* Day traders
Purpose:
* Tracks short-term momentum
* Fast trend changes
Price above 9 EMA:
📈 Short-term bullish
Price below 9 EMA:
📉 Short-term bearish
---
## 20 EMA
One of the most popular crypto MAs.
Acts as:
* Trend filter
* Dynamic support
* Dynamic resistance
Strong trends often bounce repeatedly from the 20 EMA.
---
## 50 EMA
Represents the medium-term trend.
Institutional traders watch it closely.
Bullish:
Price above 50 EMA
Bearish:
Price below 50 EMA
---
## 200 EMA
The king of moving averages.
Used to identify long-term trend direction.
Bull Market:
Price above 200 EMA
Bear Market:
Price below 200 EMA
---
# Moving Average Crossovers
One MA crossing another often signals a trend shift.
## Golden Cross 🟢
Occurs when:
50 MA crosses ABOVE 200 MA
Bullish signal.
Suggests long-term strength.
---
## Death Cross 🔴
Occurs when:
50 MA crosses BELOW 200 MA
Bearish signal.
Suggests long-term weakness.
---
# Dynamic Support and Resistance
Moving averages often act like invisible support and resistance levels.
Example:
In an uptrend:
* Price pulls back
* Touches 20 EMA
* Buyers step in
* Trend continues
This is called a "trend continuation bounce."
---
# Moving Average Stacking
The strongest trends occur when multiple MAs align.
### Bullish Stack
9 EMA > 20 EMA > 50 EMA > 200 EMA
This shows:
* Strong momentum
* Strong trend
* Strong buyer control
---
### Bearish Stack
9 EMA < 20 EMA < 50 EMA < 200 EMA
This shows:
* Weakness
* Strong selling pressure
* Bearish trend
---
# How Crypto Traders Use Moving Averages
### Trend Trading
Only buy when:
* Price above 50 EMA
* Price above 200 EMA
---
### Pullback Entries
Wait for:
* Uptrend
* Pullback into 20 EMA
* Bullish reaction candle
Enter after confirmation.
---
### Breakout Confirmation
A breakout is stronger when:
* Price breaks resistance
* Price closes above key EMAs
* Volume increases
---
# Common Mistakes
❌ Using only one MA
❌ Trading every crossover
❌ Ignoring volume
❌ Ignoring market structure
❌ Using MAs during choppy markets
Moving averages work best in trending markets.
---
# Best MA Setup for Crypto
### Beginners
* 20 EMA
* 50 EMA
* 200 EMA
### Swing Traders
* 20 EMA
* 50 EMA
* 100 EMA
* 200 EMA
### Scalpers
* 9 EMA
* 20 EMA
* 50 EMA
---
# Professional Trader Perspective
Moving averages should not be used alone.
The best traders combine them with:
* Market Structure
* Support & Resistance
* Volume
* Liquidity Zones
* Trendlines
* Fibonacci Levels
Moving averages are not prediction tools. They are **trend-following tools** that help traders stay on the right side of the market.
### Simple Rule
📈 Price above 200 EMA = Look for longs.
📉 Price below 200 EMA = Be cautious with longs and favor shorts.
That's why you'll find the 20 EMA, 50 EMA, and 200 EMA on almost every professional trader's chart.

إخلاء المسؤولية
لا يُقصد بالمعلومات والمنشورات أن تكون، أو تشكل، أي نصيحة مالية أو استثمارية أو تجارية أو أنواع أخرى من النصائح أو التوصيات المقدمة أو المعتمدة من TradingView. اقرأ المزيد في شروط الاستخدام.
إخلاء المسؤولية
لا يُقصد بالمعلومات والمنشورات أن تكون، أو تشكل، أي نصيحة مالية أو استثمارية أو تجارية أو أنواع أخرى من النصائح أو التوصيات المقدمة أو المعتمدة من TradingView. اقرأ المزيد في شروط الاستخدام.