
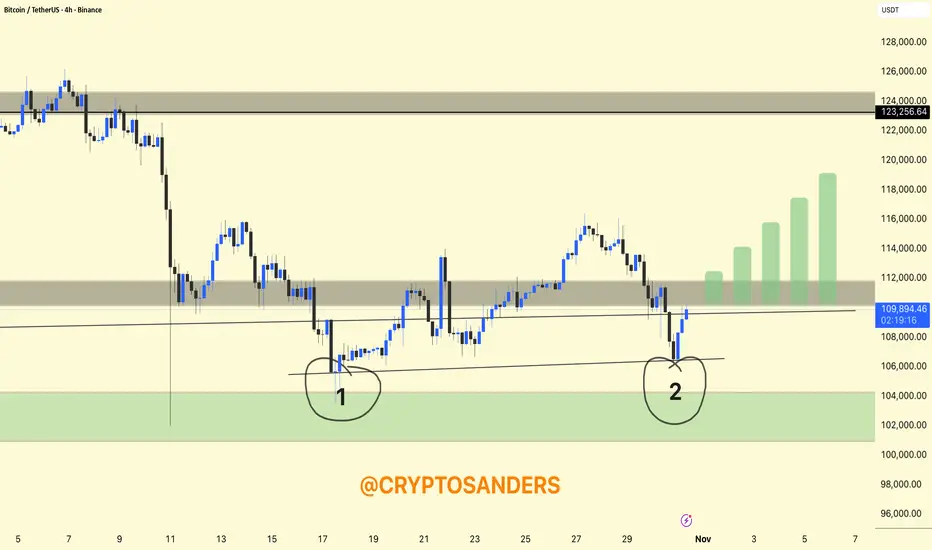
BTCUSDT 4H Chart Analysis
Pattern: The chart shows a double bottom at the $106,000–$107,000 zone (circled as points 1 and 2). Price bounced strongly after retesting this support region twice.
Support & Resistance: The green box highlights the major support zone, which has held firm and led to a reversal. Resistance remains at the gray band around $112,000–$113,000.
Setup: After confirming the double bottom, BTC has reclaimed $110,000 and is pushing toward resistance. The green bars suggest a bullish projection, targeting higher levels toward $117,000–$123,000 if BTC sustains momentum above resistance.
Summary:
BTC is bullish above $110,000, with a double bottom support in place. A successful breakout above local resistance could accelerate the uptrend in the coming sessions.
DYOR | NFA
Pattern: The chart shows a double bottom at the $106,000–$107,000 zone (circled as points 1 and 2). Price bounced strongly after retesting this support region twice.
Support & Resistance: The green box highlights the major support zone, which has held firm and led to a reversal. Resistance remains at the gray band around $112,000–$113,000.
Setup: After confirming the double bottom, BTC has reclaimed $110,000 and is pushing toward resistance. The green bars suggest a bullish projection, targeting higher levels toward $117,000–$123,000 if BTC sustains momentum above resistance.
Summary:
BTC is bullish above $110,000, with a double bottom support in place. A successful breakout above local resistance could accelerate the uptrend in the coming sessions.
DYOR | NFA

منشورات ذات صلة
إخلاء المسؤولية
لا يُقصد بالمعلومات والمنشورات أن تكون، أو تشكل، أي نصيحة مالية أو استثمارية أو تجارية أو أنواع أخرى من النصائح أو التوصيات المقدمة أو المعتمدة من TradingView. اقرأ المزيد في شروط الاستخدام.
منشورات ذات صلة
إخلاء المسؤولية
لا يُقصد بالمعلومات والمنشورات أن تكون، أو تشكل، أي نصيحة مالية أو استثمارية أو تجارية أو أنواع أخرى من النصائح أو التوصيات المقدمة أو المعتمدة من TradingView. اقرأ المزيد في شروط الاستخدام.