
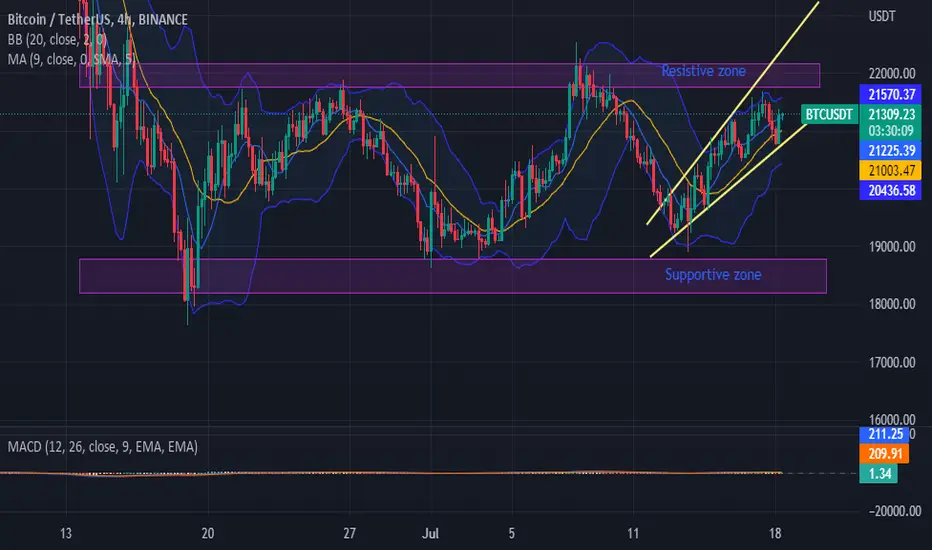
Observed rising wedge (yellow colour lines) pattern on BTCUSDT/4 hour chart
Upper side of the wedge is the resistive zone (21785-22170)/rough values
Below side of the wedge is the supportive zone (18150-18770)/rough values
Price either will hit resistive zone and go to down side(To continue rising wedge pattern)
OR
Price will break the resistive zone and go upside. (To break the market structure).
Upper side of the wedge is the resistive zone (21785-22170)/rough values
Below side of the wedge is the supportive zone (18150-18770)/rough values
Price either will hit resistive zone and go to down side(To continue rising wedge pattern)
OR
Price will break the resistive zone and go upside. (To break the market structure).

إخلاء المسؤولية
لا يُقصد بالمعلومات والمنشورات أن تكون، أو تشكل، أي نصيحة مالية أو استثمارية أو تجارية أو أنواع أخرى من النصائح أو التوصيات المقدمة أو المعتمدة من TradingView. اقرأ المزيد في شروط الاستخدام.
إخلاء المسؤولية
لا يُقصد بالمعلومات والمنشورات أن تكون، أو تشكل، أي نصيحة مالية أو استثمارية أو تجارية أو أنواع أخرى من النصائح أو التوصيات المقدمة أو المعتمدة من TradingView. اقرأ المزيد في شروط الاستخدام.