
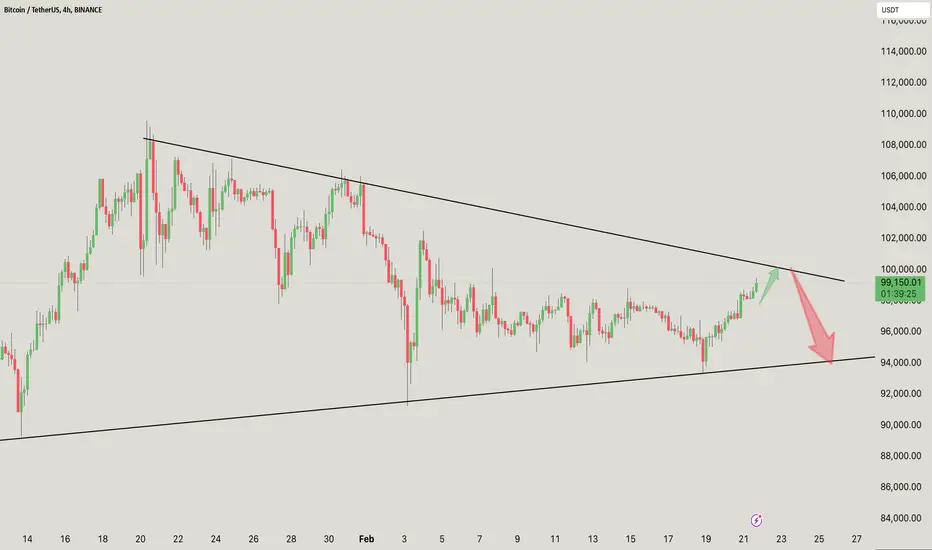
The BTC/USDT chart shows a symmetrical triangle structure, indicating a period of consolidation. The price is around 99,098.28 USDT, and it appears to be approaching the triangle's upper trendline.
The lower trendline suggests a support level near 94,000 USDT.
The upper trendline acts as resistance, around 100,000 USDT.
Possible Movement: A breakout above the resistance could lead to upward momentum, while a drop below the support could indicate a bearish trend.
Monitor the trading volume during these breakout attempts to confirm the direction!
If you found this analysis helpful, hit the Like button and share your thoughts or questions in the comments below. Your feedback matters!
Thanks for your support!
DYOR. NFA
The lower trendline suggests a support level near 94,000 USDT.
The upper trendline acts as resistance, around 100,000 USDT.
Possible Movement: A breakout above the resistance could lead to upward momentum, while a drop below the support could indicate a bearish trend.
Monitor the trading volume during these breakout attempts to confirm the direction!
If you found this analysis helpful, hit the Like button and share your thoughts or questions in the comments below. Your feedback matters!
Thanks for your support!
DYOR. NFA

منشورات ذات صلة
إخلاء المسؤولية
لا يُقصد بالمعلومات والمنشورات أن تكون، أو تشكل، أي نصيحة مالية أو استثمارية أو تجارية أو أنواع أخرى من النصائح أو التوصيات المقدمة أو المعتمدة من TradingView. اقرأ المزيد في شروط الاستخدام.
منشورات ذات صلة
إخلاء المسؤولية
لا يُقصد بالمعلومات والمنشورات أن تكون، أو تشكل، أي نصيحة مالية أو استثمارية أو تجارية أو أنواع أخرى من النصائح أو التوصيات المقدمة أو المعتمدة من TradingView. اقرأ المزيد في شروط الاستخدام.