
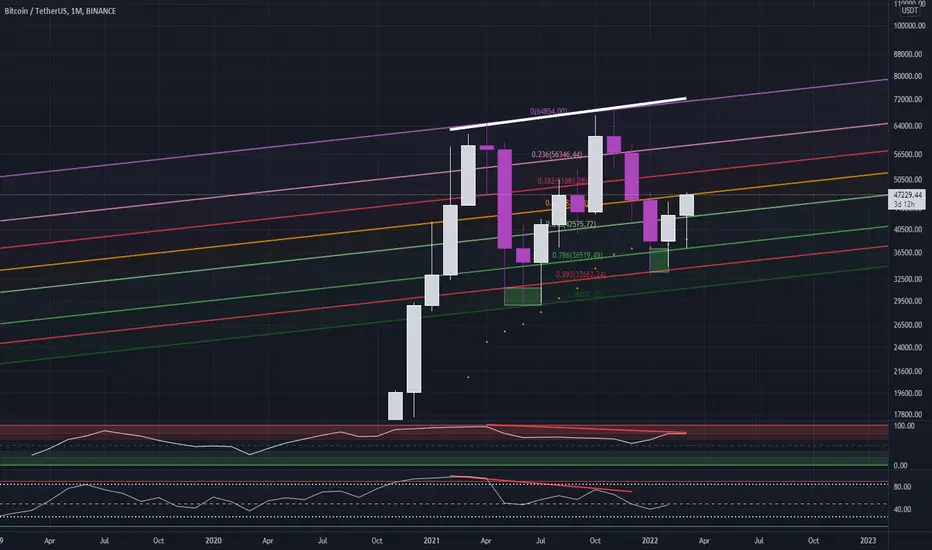
Hi guys I was looking at the weekly chart for bitcoin and I noticed something on the rsi. A huge hidden bearish divergence can be seen from last year's top to this year's top. I am still very bullish on bitcoin and do hope that this does not affect the price action of bitcoin in the following weeks to months even though we have had a massive break out to the 40k levels. Just a warning to be cautious. Just wanted to point that out in the case bitcoin dumps back down lower.
ملاحظة
Apologies I meant the monthly chart not the weekly one. Thank you cschena123
ملاحظة
However the hidden bearish can also be seen on the weekly chart as well!
منشورات ذات صلة
إخلاء المسؤولية
لا يُقصد بالمعلومات والمنشورات أن تكون، أو تشكل، أي نصيحة مالية أو استثمارية أو تجارية أو أنواع أخرى من النصائح أو التوصيات المقدمة أو المعتمدة من TradingView. اقرأ المزيد في شروط الاستخدام.
منشورات ذات صلة
إخلاء المسؤولية
لا يُقصد بالمعلومات والمنشورات أن تكون، أو تشكل، أي نصيحة مالية أو استثمارية أو تجارية أو أنواع أخرى من النصائح أو التوصيات المقدمة أو المعتمدة من TradingView. اقرأ المزيد في شروط الاستخدام.