
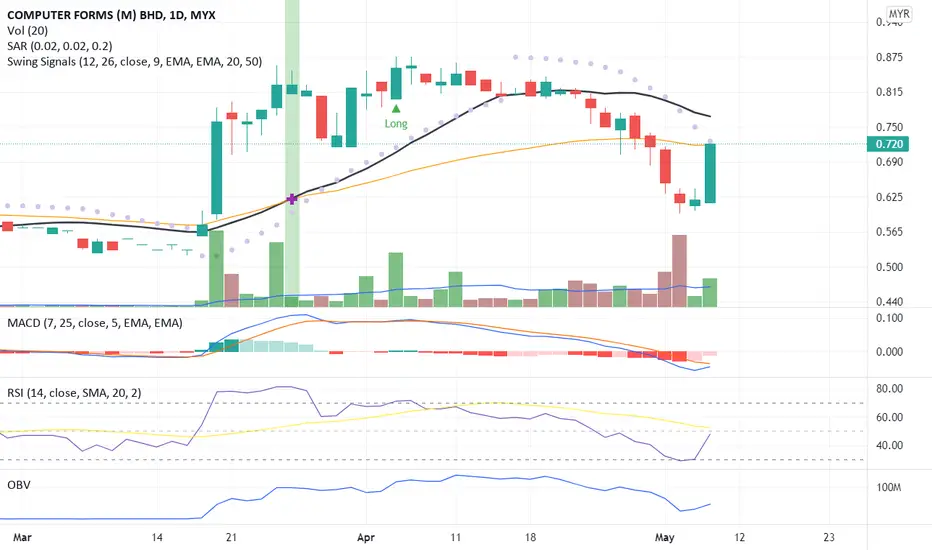
The candlestick body indicate a breakout pattern due to signicant price movement on previous trading where the price croses over the MA50 line. Hence, with probability of begining of uptrend pattern.
The RSI indicates a strong gain momumtum towards indexes 50.
MACD and OBV indicate an early sign of a divergence pattern.
Precaution for a price correction between 10% to 20% from recent price peak before continue with the uptrend momentum.
Let save CFM in WL and watchout for price uptrend movement to next price resistance, the MA20 line.
R 0.770
S 0.635
The RSI indicates a strong gain momumtum towards indexes 50.
MACD and OBV indicate an early sign of a divergence pattern.
Precaution for a price correction between 10% to 20% from recent price peak before continue with the uptrend momentum.
Let save CFM in WL and watchout for price uptrend movement to next price resistance, the MA20 line.
R 0.770
S 0.635

إخلاء المسؤولية
لا يُقصد بالمعلومات والمنشورات أن تكون، أو تشكل، أي نصيحة مالية أو استثمارية أو تجارية أو أنواع أخرى من النصائح أو التوصيات المقدمة أو المعتمدة من TradingView. اقرأ المزيد في شروط الاستخدام.
إخلاء المسؤولية
لا يُقصد بالمعلومات والمنشورات أن تكون، أو تشكل، أي نصيحة مالية أو استثمارية أو تجارية أو أنواع أخرى من النصائح أو التوصيات المقدمة أو المعتمدة من TradingView. اقرأ المزيد في شروط الاستخدام.