

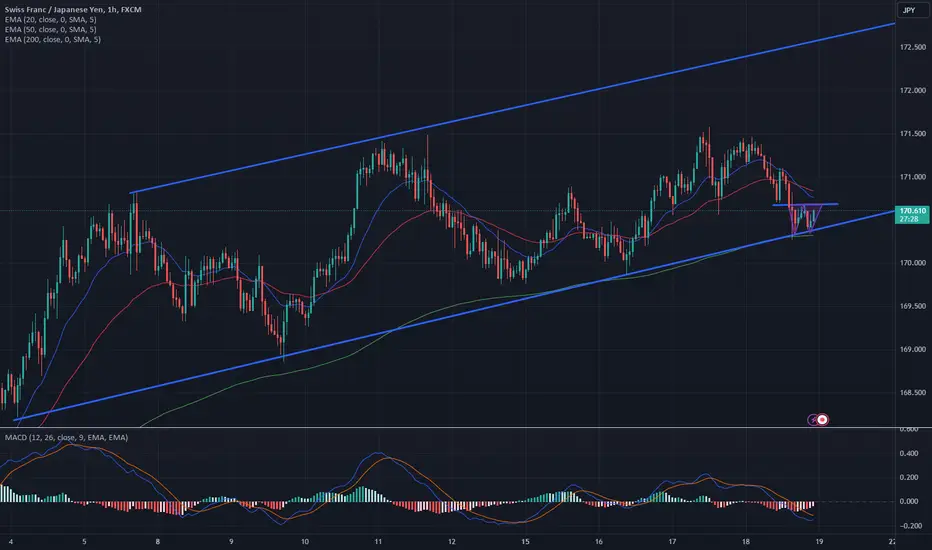
On this 1H chart for CHFJPY we can notice that the price has been moving in an up trend channel for a while now. Recently it dropped to test the up trend support. At this stage the price is forming a potential double bottom. Monitor it for a potential breakout.
Additional confluences:
- MACD can produce a bullish cross if the price starts going up to complete the Double bottom
- The 2 bottoms are re-bouncing from the 200 EMA
- If the price goes up, in can cross above the 20 and 50 EMAs. Monitor for a bullish cross
Additional confluences:
- MACD can produce a bullish cross if the price starts going up to complete the Double bottom
- The 2 bottoms are re-bouncing from the 200 EMA
- If the price goes up, in can cross above the 20 and 50 EMAs. Monitor for a bullish cross
أغلقت الصفقة: تم الوصول للهدف
Price went up and reached the rarget of the double bottom pattern. From there it dropped below the general up trend Support of the channel
Website - rtedinvesting.com/
Free Telegram Channel - t.me/rtedinvestingofficialfreechannel
Free Telegram Channel - t.me/rtedinvestingofficialfreechannel
إخلاء المسؤولية
لا يُقصد بالمعلومات والمنشورات أن تكون، أو تشكل، أي نصيحة مالية أو استثمارية أو تجارية أو أنواع أخرى من النصائح أو التوصيات المقدمة أو المعتمدة من TradingView. اقرأ المزيد في شروط الاستخدام.
Website - rtedinvesting.com/
Free Telegram Channel - t.me/rtedinvestingofficialfreechannel
Free Telegram Channel - t.me/rtedinvestingofficialfreechannel
إخلاء المسؤولية
لا يُقصد بالمعلومات والمنشورات أن تكون، أو تشكل، أي نصيحة مالية أو استثمارية أو تجارية أو أنواع أخرى من النصائح أو التوصيات المقدمة أو المعتمدة من TradingView. اقرأ المزيد في شروط الاستخدام.