
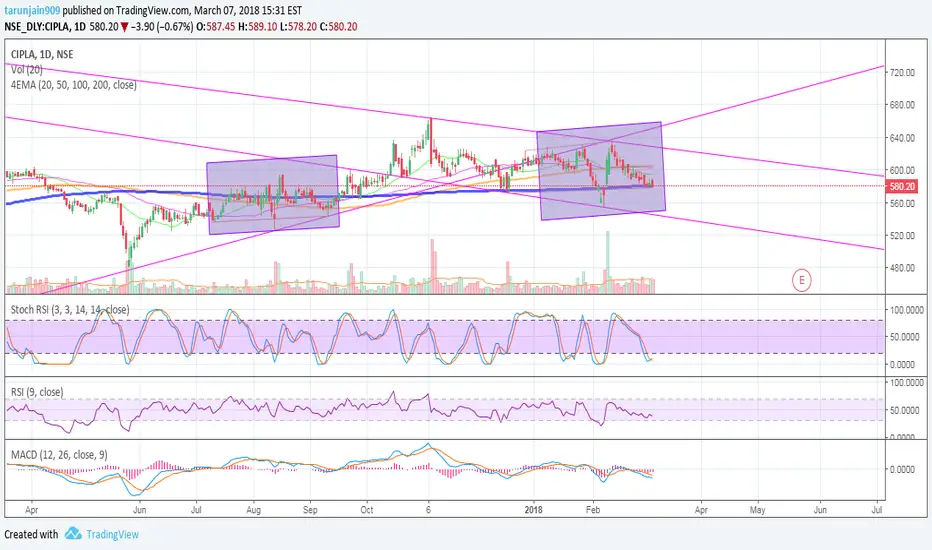
- The patterns highlighted is almost similar .. only differentiating in count of candles
- Sustaining around 200 EMA.
- only for study purpose
- Sustaining around 200 EMA.
- only for study purpose
ملاحظة
As per the historical pattern.. perfectly fitting on it. Target 635
ملاحظة
Wasn't tracking but it seems this one hit 621.90 on 02 May 2018.
منشورات ذات صلة
إخلاء المسؤولية
لا يُقصد بالمعلومات والمنشورات أن تكون، أو تشكل، أي نصيحة مالية أو استثمارية أو تجارية أو أنواع أخرى من النصائح أو التوصيات المقدمة أو المعتمدة من TradingView. اقرأ المزيد في شروط الاستخدام.
منشورات ذات صلة
إخلاء المسؤولية
لا يُقصد بالمعلومات والمنشورات أن تكون، أو تشكل، أي نصيحة مالية أو استثمارية أو تجارية أو أنواع أخرى من النصائح أو التوصيات المقدمة أو المعتمدة من TradingView. اقرأ المزيد في شروط الاستخدام.