
Concor India - Potential Double Bottom Breakout underway
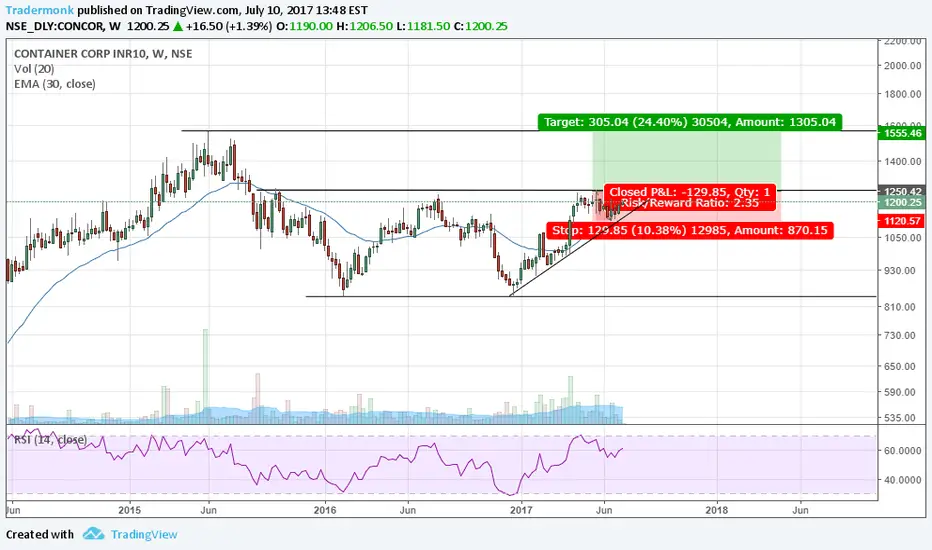
Potential Double bottom pattern (Adam & Adam formation) awaiting upward breakout observed in Concor India Ltd weekly chart.
Resistance zone is at 1200-1250 levels. A close above 1250 with higher volumes would indicate confirmation of the Double Bottom pattern formation which is a bullish sign for the stock.
Swing Trading Strategy :
Buy : Above 1250 level (on closing basis)
Target : 1550 (Old Resistance level as on 1st June 2015)
Stop Loss : Below 1120
Trade Safe !!!
Note : I have no current positions in this stock but may enter a position or multiple positions in the coming days and weeks.
Resistance zone is at 1200-1250 levels. A close above 1250 with higher volumes would indicate confirmation of the Double Bottom pattern formation which is a bullish sign for the stock.
Swing Trading Strategy :
Buy : Above 1250 level (on closing basis)
Target : 1550 (Old Resistance level as on 1st June 2015)
Stop Loss : Below 1120
Trade Safe !!!
Note : I have no current positions in this stock but may enter a position or multiple positions in the coming days and weeks.
تم فتح الصفقة
Closed above 1250
إخلاء المسؤولية
لا يُقصد بالمعلومات والمنشورات أن تكون، أو تشكل، أي نصيحة مالية أو استثمارية أو تجارية أو أنواع أخرى من النصائح أو التوصيات المقدمة أو المعتمدة من TradingView. اقرأ المزيد في شروط الاستخدام.
إخلاء المسؤولية
لا يُقصد بالمعلومات والمنشورات أن تكون، أو تشكل، أي نصيحة مالية أو استثمارية أو تجارية أو أنواع أخرى من النصائح أو التوصيات المقدمة أو المعتمدة من TradingView. اقرأ المزيد في شروط الاستخدام.