
Setup
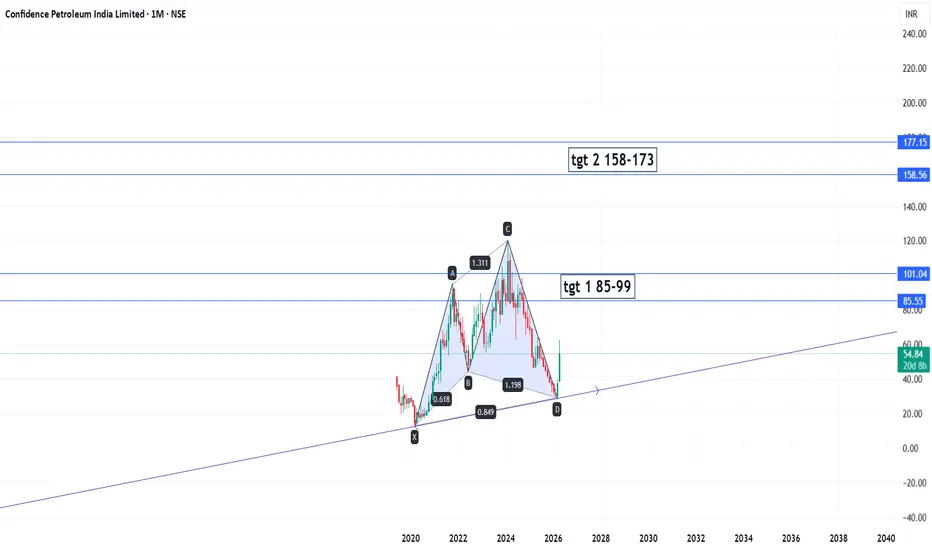
The Cypher pattern is a 4-leg reversal pattern that relies on specific Fibonacci ratios.
Here is how this specific setup validates:
B Point: Must be a retracement of the XA leg, typically between 0.382 and 0.618.
Here, it sits perfectly at the 0.618 level.C Point:
This is a "beyond" extension of the XA leg, reaching at least 1.272. On this chart, it pushed to 1.311, creating a higher high and trapping early shorters.
D Point (The Entry): The completion point occurs at the 0.786 retracement of the XC move. As we can see, price has touched the 0.849 (relative to the whole move) and is finding support on the multi-year trendline.
🎯 Key Levels to Watch
The chart identifies two clear supply zones where liquidity is expected to sit:
Target 1 (85–99): This aligns with the previous structural resistance and the 0.618$
Fibonacci retracement of the CD leg.
Target 2 (158–173): A long-term target that aims for a retest and breakout of the previous "C" point highs.
💡 Trading WisdomHarmonic patterns are high-probability setups, but they aren't magic.
Confirmation is King: Look for a bullish candle close on the weekly or monthly timeframe to confirm the "D" point reversal.
Risk Management: A stop-loss should typically be placed just below the X point. If price breaks the origin of the pattern, the harmonic structure is invalidated.
Confluence: The fact that the "D" point coincides with the purple ascending trendline adds a significant layer of technical weight to this trade.
The Cypher pattern is a 4-leg reversal pattern that relies on specific Fibonacci ratios.
Here is how this specific setup validates:
B Point: Must be a retracement of the XA leg, typically between 0.382 and 0.618.
Here, it sits perfectly at the 0.618 level.C Point:
This is a "beyond" extension of the XA leg, reaching at least 1.272. On this chart, it pushed to 1.311, creating a higher high and trapping early shorters.
D Point (The Entry): The completion point occurs at the 0.786 retracement of the XC move. As we can see, price has touched the 0.849 (relative to the whole move) and is finding support on the multi-year trendline.
🎯 Key Levels to Watch
The chart identifies two clear supply zones where liquidity is expected to sit:
Target 1 (85–99): This aligns with the previous structural resistance and the 0.618$
Fibonacci retracement of the CD leg.
Target 2 (158–173): A long-term target that aims for a retest and breakout of the previous "C" point highs.
💡 Trading WisdomHarmonic patterns are high-probability setups, but they aren't magic.
Confirmation is King: Look for a bullish candle close on the weekly or monthly timeframe to confirm the "D" point reversal.
Risk Management: A stop-loss should typically be placed just below the X point. If price breaks the origin of the pattern, the harmonic structure is invalidated.
Confluence: The fact that the "D" point coincides with the purple ascending trendline adds a significant layer of technical weight to this trade.

إخلاء المسؤولية
لا يُقصد بالمعلومات والمنشورات أن تكون، أو تشكل، أي نصيحة مالية أو استثمارية أو تجارية أو أنواع أخرى من النصائح أو التوصيات المقدمة أو المعتمدة من TradingView. اقرأ المزيد في شروط الاستخدام.
إخلاء المسؤولية
لا يُقصد بالمعلومات والمنشورات أن تكون، أو تشكل، أي نصيحة مالية أو استثمارية أو تجارية أو أنواع أخرى من النصائح أو التوصيات المقدمة أو المعتمدة من TradingView. اقرأ المزيد في شروط الاستخدام.