
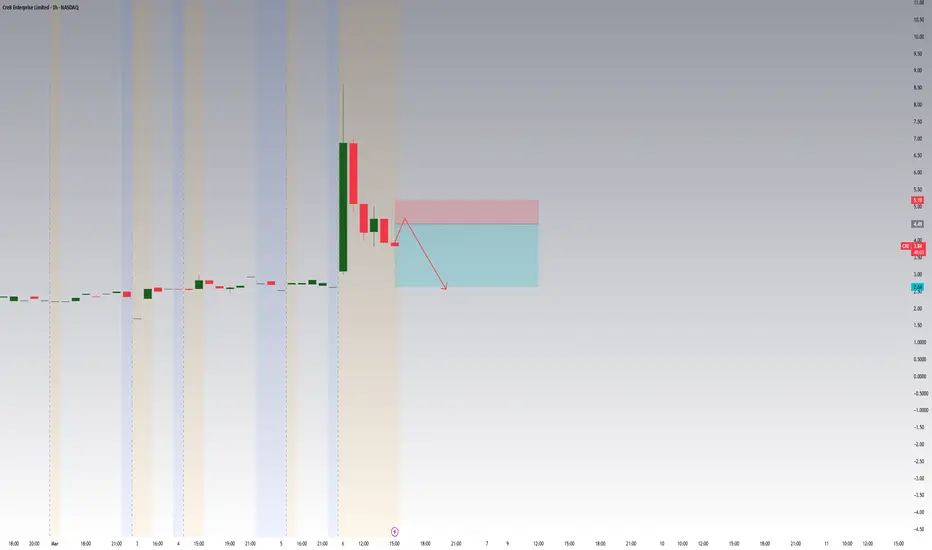
Cre8 Enterprise (CRE) completed a 1:12 reverse split, and the stock is now showing a strong premarket move of roughly +49%. Reverse splits often create temporary volatility because the float becomes smaller and speculative traders rush in. However, these moves are frequently technical rather than fundamental.
Looking at the daily structure, the stock has been in a prolonged downtrend with consistent lower highs and lower lows. The current premarket move is pushing price directly into a prior consolidation area around 3.80–4.00, which previously acted as resistance.
This area is important because it represents a zone where earlier buyers may be trapped and looking to exit if price revisits it. If the stock opens near this region and fails to hold above it, the move could lose momentum and lead to a retracement toward lower levels.
Key levels to watch:
Resistance: 3.80–4.00
Higher resistance: 5.00–5.50
Support: 2.20–2.50
If price holds above the resistance zone with strong volume, the move could extend further. However, if the stock shows rejection near the resistance area and loses intraday strength, the prior downtrend structure may remain dominant.
As always, volatility around reverse splits can be significant, so careful risk management is essential.
This analysis is for educational purposes and reflects a technical view based on current chart structure.
Looking at the daily structure, the stock has been in a prolonged downtrend with consistent lower highs and lower lows. The current premarket move is pushing price directly into a prior consolidation area around 3.80–4.00, which previously acted as resistance.
This area is important because it represents a zone where earlier buyers may be trapped and looking to exit if price revisits it. If the stock opens near this region and fails to hold above it, the move could lose momentum and lead to a retracement toward lower levels.
Key levels to watch:
Resistance: 3.80–4.00
Higher resistance: 5.00–5.50
Support: 2.20–2.50
If price holds above the resistance zone with strong volume, the move could extend further. However, if the stock shows rejection near the resistance area and loses intraday strength, the prior downtrend structure may remain dominant.
As always, volatility around reverse splits can be significant, so careful risk management is essential.
This analysis is for educational purposes and reflects a technical view based on current chart structure.

Sharing clean, logical market analysis focused on liquidity, structure and volume. No signals, no pressure — just education. If you want more insights, you’re welcome to join: t.me/CE3vdc5m72w4MjRk
إخلاء المسؤولية
لا يُقصد بالمعلومات والمنشورات أن تكون، أو تشكل، أي نصيحة مالية أو استثمارية أو تجارية أو أنواع أخرى من النصائح أو التوصيات المقدمة أو المعتمدة من TradingView. اقرأ المزيد في شروط الاستخدام.
Sharing clean, logical market analysis focused on liquidity, structure and volume. No signals, no pressure — just education. If you want more insights, you’re welcome to join: t.me/CE3vdc5m72w4MjRk
إخلاء المسؤولية
لا يُقصد بالمعلومات والمنشورات أن تكون، أو تشكل، أي نصيحة مالية أو استثمارية أو تجارية أو أنواع أخرى من النصائح أو التوصيات المقدمة أو المعتمدة من TradingView. اقرأ المزيد في شروط الاستخدام.