
CTD 4H - Coteccons Construction JSC | Bounce From Support, Headi
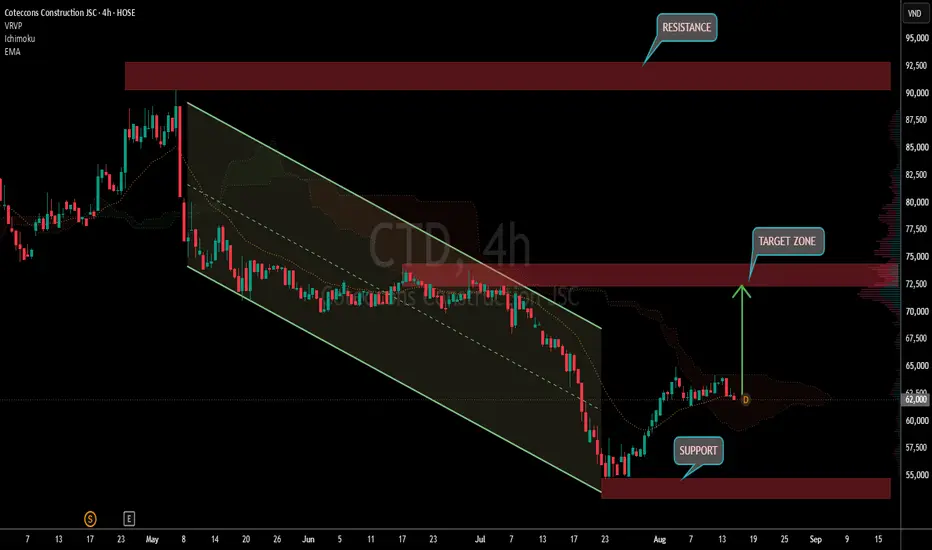
This is the Coteccons Construction JSC - CTD 4-Hour chart on HOSE from TradingView.
Chart Analysis:
1. Downtrend Channel: Price was in a clear falling channel for weeks. Multiple rejections from the top of the channel.
2. Support Bounce: Recently price dropped to the SUPPORT zone marked in pink around ∼55,000. Got a strong bullish reaction from there.
3. Recovery: Since the bounce, CTD has been climbing up. It’s now trading above the channel and testing mid-range levels.
4. Next Move: Chart shows an arrow pointing to the TARGET ZONE in red around ∼72,500 - 73,000. That was previous resistance.
Key Levels to Watch:
- Support: ∼55,000 - 56,000 - Pink zone. Must hold to keep bullish momentum
- Resistance / Target Zone: ∼72,500 - 73,000 - Red zone. Breakout here could open move toward ∼81,000 "RESISTANCE"
- Immediate: Watch for pullback to support or consolidation before next push up
Bias: Bullish while above support. If price breaks and holds above the 72,500 TARGET ZONE, trend shifts back to bullish. Rejection there = pullback likely.
Educational only. Not financial advice.
تم فتح الصفقة
active
t.me/+iZwBzq15KTM1Mzc0
join telegram for free signal on gold and different markets
t.me/+iZwBzq15KTM1Mzc0
join free telegram channel
join telegram for free signal on gold and different markets
t.me/+iZwBzq15KTM1Mzc0
join free telegram channel
منشورات ذات صلة
إخلاء المسؤولية
لا يُقصد بالمعلومات والمنشورات أن تكون، أو تشكل، أي نصيحة مالية أو استثمارية أو تجارية أو أنواع أخرى من النصائح أو التوصيات المقدمة أو المعتمدة من TradingView. اقرأ المزيد في شروط الاستخدام.
t.me/+iZwBzq15KTM1Mzc0
join telegram for free signal on gold and different markets
t.me/+iZwBzq15KTM1Mzc0
join free telegram channel
join telegram for free signal on gold and different markets
t.me/+iZwBzq15KTM1Mzc0
join free telegram channel
منشورات ذات صلة
إخلاء المسؤولية
لا يُقصد بالمعلومات والمنشورات أن تكون، أو تشكل، أي نصيحة مالية أو استثمارية أو تجارية أو أنواع أخرى من النصائح أو التوصيات المقدمة أو المعتمدة من TradingView. اقرأ المزيد في شروط الاستخدام.