#CTSI/BTC (May 31)
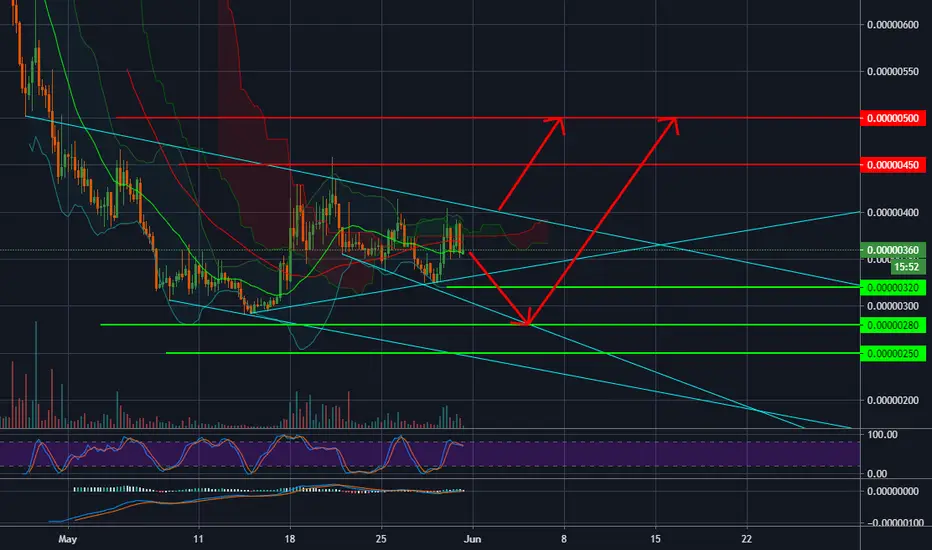
At this moment, what we can see on CTSI chart is that the selling force is dominant and the purpose of pushing the price up is to sell large quantities of CTSI.
In addition, CTSI is in a very bad pattern, Symmetrical Triangle in downtrend, so the price direction is moving down.
We will buy CTSI in 2 cases :
- Break out and stand stable above 400sts
- Catch gradually at these points : 320 - 280 and 250sts
The nearest sell target is 450 and 500
In addition, CTSI is in a very bad pattern, Symmetrical Triangle in downtrend, so the price direction is moving down.
We will buy CTSI in 2 cases :
- Break out and stand stable above 400sts
- Catch gradually at these points : 320 - 280 and 250sts
The nearest sell target is 450 and 500

إخلاء المسؤولية
لا يُقصد بالمعلومات والمنشورات أن تكون، أو تشكل، أي نصيحة مالية أو استثمارية أو تجارية أو أنواع أخرى من النصائح أو التوصيات المقدمة أو المعتمدة من TradingView. اقرأ المزيد في شروط الاستخدام.
إخلاء المسؤولية
لا يُقصد بالمعلومات والمنشورات أن تكون، أو تشكل، أي نصيحة مالية أو استثمارية أو تجارية أو أنواع أخرى من النصائح أو التوصيات المقدمة أو المعتمدة من TradingView. اقرأ المزيد في شروط الاستخدام.