تم تحديثه
digidao behaving nicely
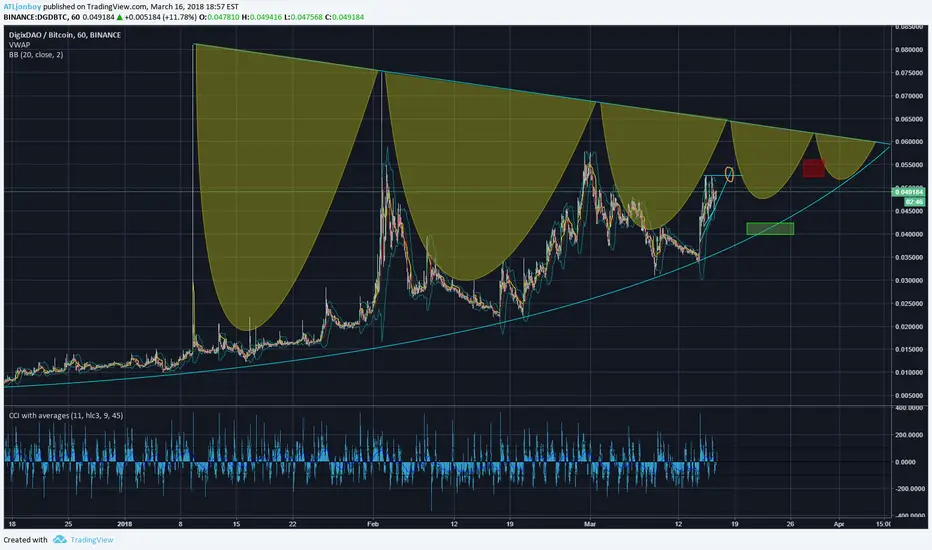
she has been bouncing perfectly on that bottom curve.
the big elipses i have hanging from the top trend line fit a nice volume pattern.
i predicted the last two curved paths and she is folding right in line.
watch this graph for the next week. if she keeps tracking as expected then the green box is the buy in and the red box is the sell target.
nice 20% trade for a week.
lets watch as she heads to that yellow circle and then plummets back to the blue curved bottom line......
ملاحظة
i added the forecaster tool... it says @ 35% trade over 6 days. not too shabbyملاحظة
looks like she ran out of steam and did not hit that first gold target.that decreases the next bounce to only 24% and moves the buy in date to midnight tonight!
ملاحظة
may even hit the line as early as 6:30 pm eastern.it could still be a 30% run over 5 days
ملاحظة
she gained a little steam and is back on track with that original green box...ملاحظة
i just put all my day trading money in at .04 with a stop limit at .038if it doesn't actually boop the line and shoots up like last time i don't want to miss it
ملاحظة
she usually exits the dip and into the green target right there at the .618 retracementlooks almost perfect.
ملاحظة
those two red lines are my stop trigger and the limit sellملاحظة
seems like we have the market in a catch 22.btc may also see a 35% gain over the next week. ince this is a btc pair. if btc fires off first it should crash the price of dgd enough to trigger the stop loss and put the $ in btc for the ride up...
as dgd spikes, i will probably create a trailing stop loss so that my safe guards chase it up the incline.

إخلاء المسؤولية
لا يُقصد بالمعلومات والمنشورات أن تكون، أو تشكل، أي نصيحة مالية أو استثمارية أو تجارية أو أنواع أخرى من النصائح أو التوصيات المقدمة أو المعتمدة من TradingView. اقرأ المزيد في شروط الاستخدام.
إخلاء المسؤولية
لا يُقصد بالمعلومات والمنشورات أن تكون، أو تشكل، أي نصيحة مالية أو استثمارية أو تجارية أو أنواع أخرى من النصائح أو التوصيات المقدمة أو المعتمدة من TradingView. اقرأ المزيد في شروط الاستخدام.