
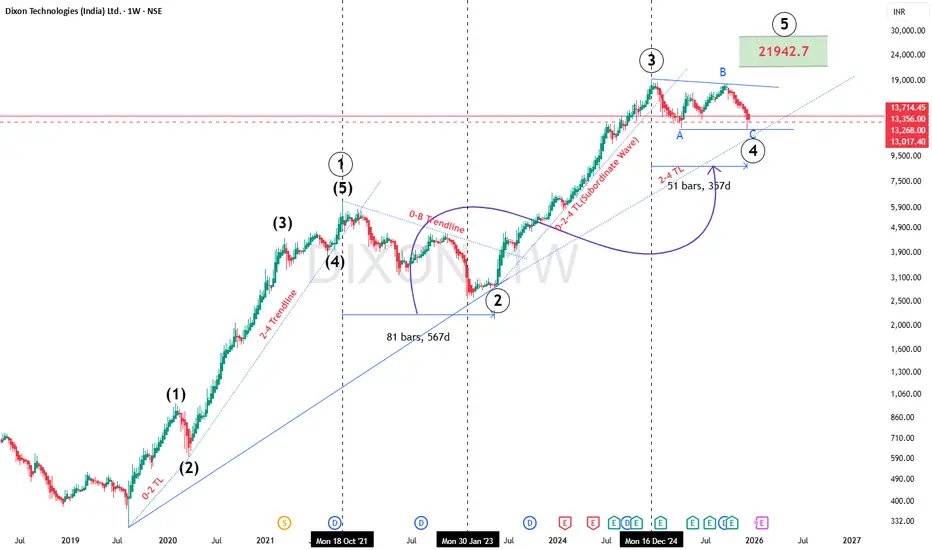
📊 Dixon Technologies (India) Ltd – Weekly Chart Analysis (Elliott Wave + Trend Structure)
🔍 Big Picture
This is a long-term weekly chart analysis focusing on Elliott Wave structure, trendline behavior, time symmetry, and corrective patterns. The stock has completed a strong multi-year impulse and is currently undergoing a higher-degree correction/consolidation before the next potential expansion.
🟢 Primary Trend Structure
The stock has respected a rising base trendline originating from the 2019 lows.
Multiple corrections have terminated near the same rising support, confirming institutional accumulation.
The overall structure remains bullish unless the major trendline breaks decisively.
🌊 Elliott Wave Interpretation
🔹 Major Impulse (Completed)
A 5-wave impulsive structure is visible from the 2019 bottom.
Wave (3) was the strongest and steepest, which is typical of impulsive markets.
Wave (5) showed relative momentum slowdown, hinting at an upcoming corrective phase.
🔹 Corrective Phase (In Progress)
The current price action resembles a larger-degree corrective structure (ABC / complex correction).
Sub-waves A – B – C are forming within a descending channel / range.
The correction has so far respected key horizontal demand zones around ₹12,000–₹12,800.
📐 Trendlines & Geometry
A 2–4 trendline has guided price throughout the impulse and is now acting as a dynamic support reference.
Previous corrections show time symmetry:
Earlier correction: ~81 bars
Recent correction: ~51 bars
This suggests the market is maturing within the corrective phase.
🎯 Key Levels to Watch
Support Zone: ₹12,700 – ₹13,000
Breakdown below this zone may extend the correction.
Resistance Zone: ₹17,000 – ₹18,000
A strong breakout above this range may confirm the start of Wave (5) of a higher degree.
Long-Term Projection (If bullish structure resumes): ~₹21,900 (based on wave projection & channel expansion).
🧠 What This Means
As long as price holds the major rising trendline, the structure remains constructively bullish.
The ongoing consolidation appears to be preparatory rather than distributive.
A confirmed breakout with volume could signal the next impulsive leg upward.
please follow for more such research...
⚠️ Disclaimer (Important)
This analysis is strictly for educational and informational purposes only. It is not a buy or sell recommendation.Elliott Wave analysis is subjective and can change with new price data. Please do your own research, use proper risk management, and consult a registered financial advisor before making any trading or investment decisions.

إخلاء المسؤولية
لا يُقصد بالمعلومات والمنشورات أن تكون، أو تشكل، أي نصيحة مالية أو استثمارية أو تجارية أو أنواع أخرى من النصائح أو التوصيات المقدمة أو المعتمدة من TradingView. اقرأ المزيد في شروط الاستخدام.
إخلاء المسؤولية
لا يُقصد بالمعلومات والمنشورات أن تكون، أو تشكل، أي نصيحة مالية أو استثمارية أو تجارية أو أنواع أخرى من النصائح أو التوصيات المقدمة أو المعتمدة من TradingView. اقرأ المزيد في شروط الاستخدام.