
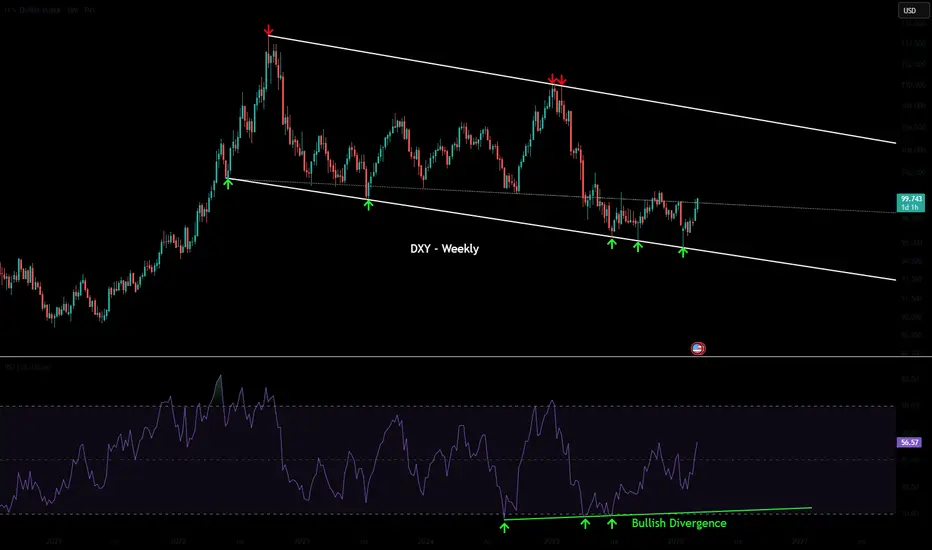
The DXY remains well within its falling wedge pattern and is approaching a breakout on the lower timeframes. I wanted to publish this post first to establish the macro context before diving into the daily timeframe in my next post.
The two main levels to watch are the lower white trendline (green arrows) and the upper white trendline (red arrows). There is also a third significant trendline worth noting: the dotted white trendline, which has played an important role in price action throughout this structure.
The RSI is also maintaining an upward trajectory following the bullish divergence that formed between August 2024 and June 2025.
In my next post, I will dive into the daily timeframe to examine why this setup is significant and explore the possibility of the DXY running back up toward the upper white trendline.
The two main levels to watch are the lower white trendline (green arrows) and the upper white trendline (red arrows). There is also a third significant trendline worth noting: the dotted white trendline, which has played an important role in price action throughout this structure.
The RSI is also maintaining an upward trajectory following the bullish divergence that formed between August 2024 and June 2025.
In my next post, I will dive into the daily timeframe to examine why this setup is significant and explore the possibility of the DXY running back up toward the upper white trendline.

إخلاء المسؤولية
لا يُقصد بالمعلومات والمنشورات أن تكون، أو تشكل، أي نصيحة مالية أو استثمارية أو تجارية أو أنواع أخرى من النصائح أو التوصيات المقدمة أو المعتمدة من TradingView. اقرأ المزيد في شروط الاستخدام.
إخلاء المسؤولية
لا يُقصد بالمعلومات والمنشورات أن تكون، أو تشكل، أي نصيحة مالية أو استثمارية أو تجارية أو أنواع أخرى من النصائح أو التوصيات المقدمة أو المعتمدة من TradingView. اقرأ المزيد في شروط الاستخدام.