
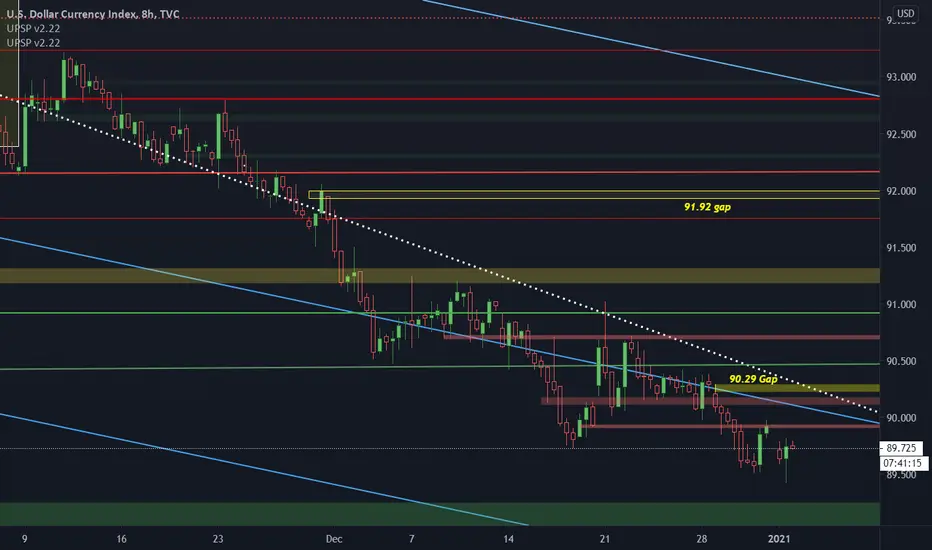
chart explained below .. just a simple dxy chart
ONLY THING NEW i added to these charts are the rectangles
1: the YELLOW boxes are just gaps left by the dxy
2: (greenish / redish box ) are my new custom supply and demand zones
white dotted line connects : mid march - mid may highs .. as shown in previous charts
previous chart :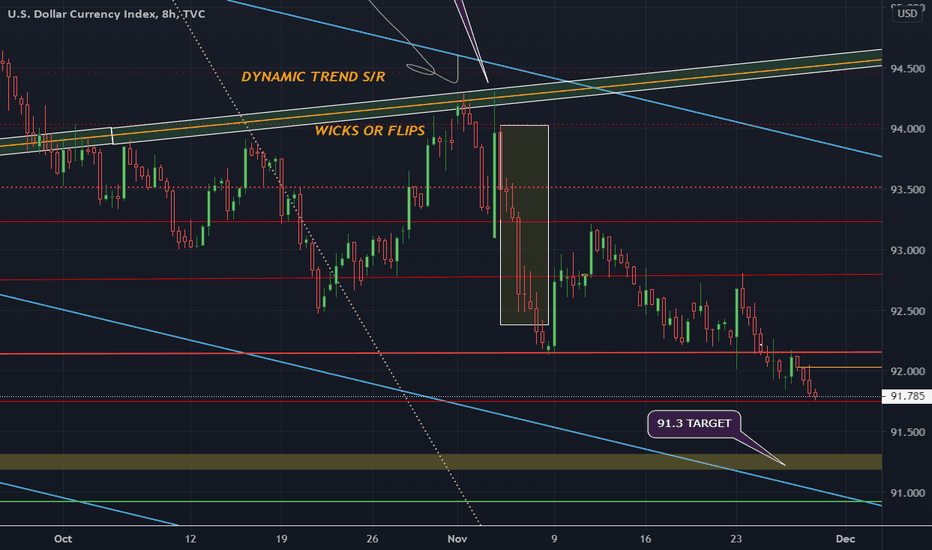
blue lines are cloned trend lines that i've discovered are acting as support/resistance to the trend
green / red lines - horizontal levels to be aware of
ONLY THING NEW i added to these charts are the rectangles
1: the YELLOW boxes are just gaps left by the dxy
2; (greenish / redish box ) are my new custim supply and demand zones
ONLY THING NEW i added to these charts are the rectangles
1: the YELLOW boxes are just gaps left by the dxy
2: (greenish / redish box ) are my new custom supply and demand zones
white dotted line connects : mid march - mid may highs .. as shown in previous charts
previous chart :
blue lines are cloned trend lines that i've discovered are acting as support/resistance to the trend
green / red lines - horizontal levels to be aware of
ONLY THING NEW i added to these charts are the rectangles
1: the YELLOW boxes are just gaps left by the dxy
2; (greenish / redish box ) are my new custim supply and demand zones
ملاحظة
easy zone calls but im posting this to say that yeah the dollar has bounced but not its sitting along last years down trend.. pay attention to the white dotted line from mid-Mrch to mid-May highs ..today we are here ..

إخلاء المسؤولية
لا يُقصد بالمعلومات والمنشورات أن تكون، أو تشكل، أي نصيحة مالية أو استثمارية أو تجارية أو أنواع أخرى من النصائح أو التوصيات المقدمة أو المعتمدة من TradingView. اقرأ المزيد في شروط الاستخدام.
إخلاء المسؤولية
لا يُقصد بالمعلومات والمنشورات أن تكون، أو تشكل، أي نصيحة مالية أو استثمارية أو تجارية أو أنواع أخرى من النصائح أو التوصيات المقدمة أو المعتمدة من TradingView. اقرأ المزيد في شروط الاستخدام.