
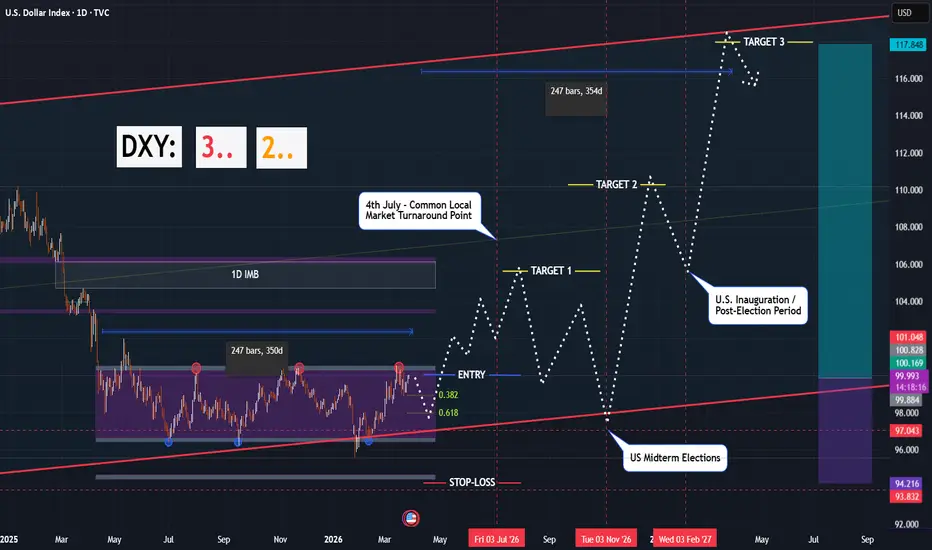
Tick Tock... Can you hear that? The clock is ticking down. DXY is sitting at the last stage of consolidation, and all that's left is to pull the trigger. Destination: Stratosphere.
# - - - - -
Technicals:
1. [RED PARALLEL LINES]: The price has been consolidating above the bottom Support Line of the Long-Term Global Ascending Trend Channel for 350 days as of today. This price behavior suggests that the market may have found a global bottom, indicating that institutional capital is accumulating USD.
2. [Gray boundaries and red/blue circles]: The horizontal accumulation channel [$96.46, $100.32] at resistance/support levels has formed dense order clusters and contains an enormous amount of volume. This range will act as a spring, potentially catapulting the price once it breaks through either the upper or lower boundary..
3. [Orientation]: The psychological mark of $100.00 plays only the orientation role, the more important point is that, taking into account the repeatedly retest of $100.00 mark as bulls are sticking to it from below, the potential upward breakthrough move will be fueled by hunting the numerous stop-losses above the $100.00 and up to $103.50, which have been set by traders who traded all the time in the channel range.
4. [Price Targets]: If price passes through the next target will be:
- the 1D Imbalance zone [$104.74, $106.12],
- the local High at $110.00 and
- the Upper Boundary of Long-term Trend Channel between $118.00 and $122.00
5. [Timely Targets]: The main targets in time for this 12-15 month long trend are:
- The 250th Anniversary of US Independence (July 4, 2026, and the following 2–3 weeks).;
- The US Midterm Elections (on and around November 3, 2026);
- The US Inauguration and post-election period, coinciding with the 2026 Annual Corporate Reporting season (throughout February 2027);
- Projected turnaround point for Wave 3 (End of March 2027).
# - - - - -
Conclusion:
That being said, the probability of the near-term upward movement for USD is very HIGH.
Note: Before the price brakes above, in worst case there could still be a retest of 0.618 Fibo or even the retest of bottom support at $97.40. So be aware.
# - - - - -
Long-Term LONG SETUP:
✅ Entry Point 1 [High Risk]: Market
✅ Entry Point 2 [MAIN]: TRIGGER Above $100.70
🛑 Stop-Loss: $94.20
🤑 Target 1: $105.70
🤑 Target 2: $110.37
🤑 Target 3: $117.97
🕒 Timeframe: 15 months
The scenario will be invalidated if we see a strong close of 1D candle below $95.30.
# - - - - -
Good Luck! ☺️
# - - - - -
DISCLAIMER: Not financial advice. Everyone must make trading decisions at their own risk, guided only by their own criteria and strategy for opening or not opening a trade.
# - - - - -
P.S. Check out my other DXY analyses in Related Publications on the right >>>
P.P.S Follow me to stay updated on this and others setups
# - - - - -
Technicals:
1. [RED PARALLEL LINES]: The price has been consolidating above the bottom Support Line of the Long-Term Global Ascending Trend Channel for 350 days as of today. This price behavior suggests that the market may have found a global bottom, indicating that institutional capital is accumulating USD.
2. [Gray boundaries and red/blue circles]: The horizontal accumulation channel [$96.46, $100.32] at resistance/support levels has formed dense order clusters and contains an enormous amount of volume. This range will act as a spring, potentially catapulting the price once it breaks through either the upper or lower boundary..
3. [Orientation]: The psychological mark of $100.00 plays only the orientation role, the more important point is that, taking into account the repeatedly retest of $100.00 mark as bulls are sticking to it from below, the potential upward breakthrough move will be fueled by hunting the numerous stop-losses above the $100.00 and up to $103.50, which have been set by traders who traded all the time in the channel range.
4. [Price Targets]: If price passes through the next target will be:
- the 1D Imbalance zone [$104.74, $106.12],
- the local High at $110.00 and
- the Upper Boundary of Long-term Trend Channel between $118.00 and $122.00
5. [Timely Targets]: The main targets in time for this 12-15 month long trend are:
- The 250th Anniversary of US Independence (July 4, 2026, and the following 2–3 weeks).;
- The US Midterm Elections (on and around November 3, 2026);
- The US Inauguration and post-election period, coinciding with the 2026 Annual Corporate Reporting season (throughout February 2027);
- Projected turnaround point for Wave 3 (End of March 2027).
# - - - - -
Conclusion:
That being said, the probability of the near-term upward movement for USD is very HIGH.
Note: Before the price brakes above, in worst case there could still be a retest of 0.618 Fibo or even the retest of bottom support at $97.40. So be aware.
# - - - - -
Long-Term LONG SETUP:
✅ Entry Point 1 [High Risk]: Market
✅ Entry Point 2 [MAIN]: TRIGGER Above $100.70
🛑 Stop-Loss: $94.20
🤑 Target 1: $105.70
🤑 Target 2: $110.37
🤑 Target 3: $117.97
🕒 Timeframe: 15 months
The scenario will be invalidated if we see a strong close of 1D candle below $95.30.
# - - - - -
Good Luck! ☺️
# - - - - -
DISCLAIMER: Not financial advice. Everyone must make trading decisions at their own risk, guided only by their own criteria and strategy for opening or not opening a trade.
# - - - - -
P.S. Check out my other DXY analyses in Related Publications on the right >>>
P.P.S Follow me to stay updated on this and others setups
تم فتح الصفقة

Visit my Risk Enforcement App → mywarner.app/
Follow me on Telegram → t.me/totsamiykaa
Watch me on YT → youtube.com/@totsamiykaa
See me on Threads → threads.com/@totsamiykaa
Follow me on Telegram → t.me/totsamiykaa
Watch me on YT → youtube.com/@totsamiykaa
See me on Threads → threads.com/@totsamiykaa
منشورات ذات صلة
إخلاء المسؤولية
لا يُقصد بالمعلومات والمنشورات أن تكون، أو تشكل، أي نصيحة مالية أو استثمارية أو تجارية أو أنواع أخرى من النصائح أو التوصيات المقدمة أو المعتمدة من TradingView. اقرأ المزيد في شروط الاستخدام.
Visit my Risk Enforcement App → mywarner.app/
Follow me on Telegram → t.me/totsamiykaa
Watch me on YT → youtube.com/@totsamiykaa
See me on Threads → threads.com/@totsamiykaa
Follow me on Telegram → t.me/totsamiykaa
Watch me on YT → youtube.com/@totsamiykaa
See me on Threads → threads.com/@totsamiykaa
منشورات ذات صلة
إخلاء المسؤولية
لا يُقصد بالمعلومات والمنشورات أن تكون، أو تشكل، أي نصيحة مالية أو استثمارية أو تجارية أو أنواع أخرى من النصائح أو التوصيات المقدمة أو المعتمدة من TradingView. اقرأ المزيد في شروط الاستخدام.