
 DYDX
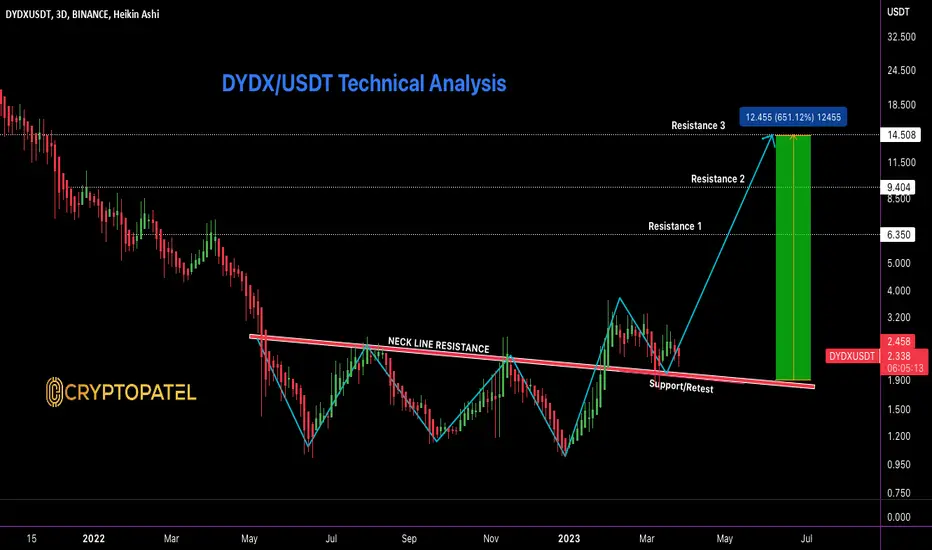
DYDXDYDX/USDT Technical Analysis:-
= The technical analysis indicates that
DYDX is looking good at its current level, with a strong neck line resistance already broken and a retest of the support level.= The strong resistance level has now become a strong support level, indicating bullish momentum. As per the chart, we are expecting
DYDX to hit our resistance levels at $6.30, / $9.40, and $14.50.This translates to a potential 650% gain from the retest/support level!
= As always, this is not financial advice, and we urge you to conduct your own research before investing in any coins.
Thank you, and happy trading!

Twitter: twitter.com/CryptoPatel
Telegram: t.me/OfficialCryptoPatel
Instagram: instagram.com/cryptopatel?utm_medium=copy_link
Telegram: t.me/OfficialCryptoPatel
Instagram: instagram.com/cryptopatel?utm_medium=copy_link
إخلاء المسؤولية
لا يُقصد بالمعلومات والمنشورات أن تكون، أو تشكل، أي نصيحة مالية أو استثمارية أو تجارية أو أنواع أخرى من النصائح أو التوصيات المقدمة أو المعتمدة من TradingView. اقرأ المزيد في شروط الاستخدام.
Twitter: twitter.com/CryptoPatel
Telegram: t.me/OfficialCryptoPatel
Instagram: instagram.com/cryptopatel?utm_medium=copy_link
Telegram: t.me/OfficialCryptoPatel
Instagram: instagram.com/cryptopatel?utm_medium=copy_link
إخلاء المسؤولية
لا يُقصد بالمعلومات والمنشورات أن تكون، أو تشكل، أي نصيحة مالية أو استثمارية أو تجارية أو أنواع أخرى من النصائح أو التوصيات المقدمة أو المعتمدة من TradingView. اقرأ المزيد في شروط الاستخدام.