
 EDENUSDT
 ### 🔍 **Chart Overview**
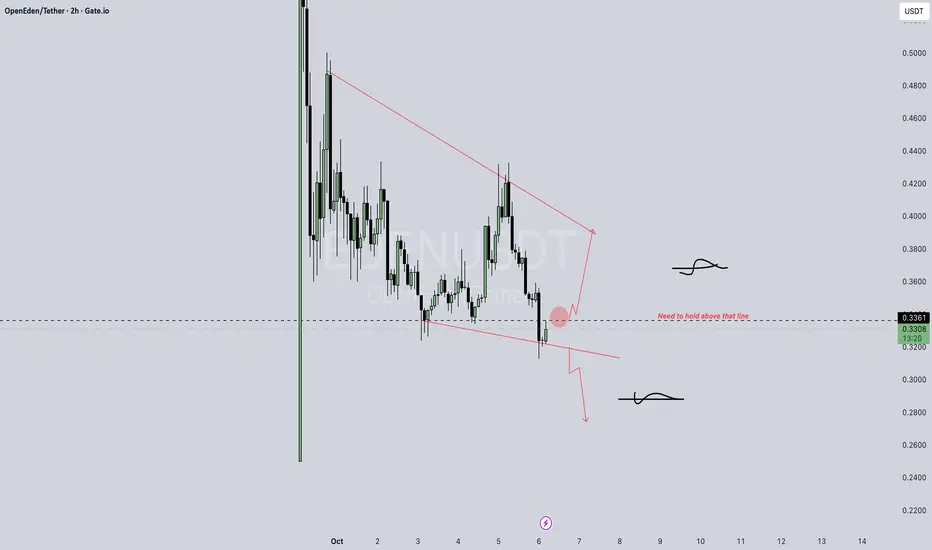
* **Pattern:** Falling wedge / descending channel — typically a *potential reversal pattern*.
* **Key Level:** Around **0.336** (marked “Need to hold above that line”).
* **Current Price:** ~0.33 USDT.
---
### 📈 **Bullish Scenario**
* If price **holds above 0.336** and confirms support, it could **break the wedge** upward.
* Possible targets:
* **First:** 0.38
* **Next:** 0.42–0.46
* Volume confirmation is important — breakout with low volume may be fake.
---
### 📉 **Bearish Scenario**
* If it **fails to hold 0.336** and drops below the lower red line →
* Next downside zones: **0.30 → 0.27**
* Could continue drifting until new support forms.
---
✅ **In short (not financial advice):**
> OpenEden is sitting at a key support. Holding above **0.336** = bullish bounce likely. Losing it = short-term bearish continuation.

إخلاء المسؤولية
لا يُقصد بالمعلومات والمنشورات أن تكون، أو تشكل، أي نصيحة مالية أو استثمارية أو تجارية أو أنواع أخرى من النصائح أو التوصيات المقدمة أو المعتمدة من TradingView. اقرأ المزيد في شروط الاستخدام.
إخلاء المسؤولية
لا يُقصد بالمعلومات والمنشورات أن تكون، أو تشكل، أي نصيحة مالية أو استثمارية أو تجارية أو أنواع أخرى من النصائح أو التوصيات المقدمة أو المعتمدة من TradingView. اقرأ المزيد في شروط الاستخدام.