
Hi everyone,
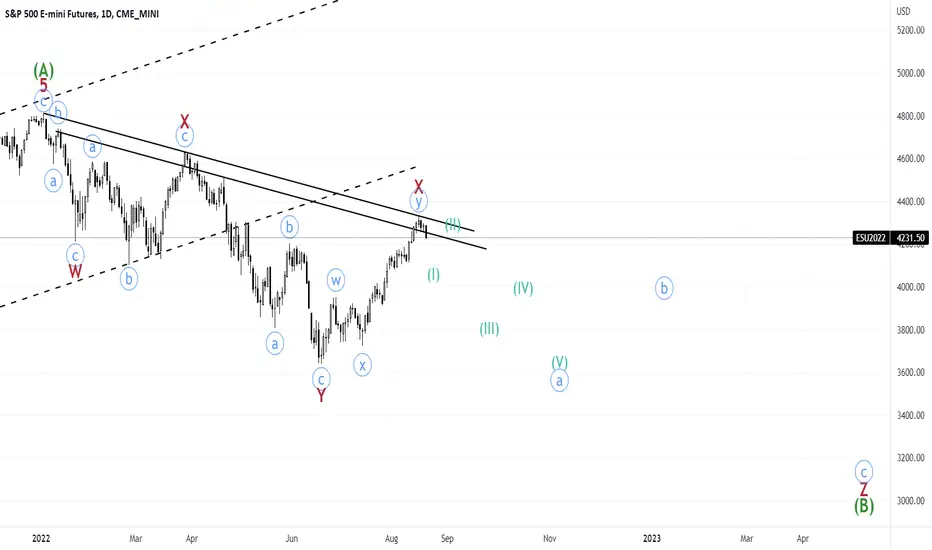
Overview: in my update on August 15th, I shared the following hourly count, expecting the market to peak around 4325. This count played out perfectly and market peaked at 4327.5! During the week, we were updating the structure of leg Z as it was developing its very early stages.

Update: as you can see, I believe that market has started the third bearish zigzag, wave Z to new lows. Looking into the hourly chart, we can see that currently we are working on wave 3 of c of (I) of a of Z. Two notes on technical analysis:
1) We can see that the upward bullish channel that was holding since July 14th was broken decisively, shown with dashed blue trendline.
2) The formation of h&s was an alert to the fact that market is topping and wave (B) of 3 of c of (I) was actually a perfect retest of the neckline of the h&s.

Overview: in my update on August 15th, I shared the following hourly count, expecting the market to peak around 4325. This count played out perfectly and market peaked at 4327.5! During the week, we were updating the structure of leg Z as it was developing its very early stages.
Update: as you can see, I believe that market has started the third bearish zigzag, wave Z to new lows. Looking into the hourly chart, we can see that currently we are working on wave 3 of c of (I) of a of Z. Two notes on technical analysis:
1) We can see that the upward bullish channel that was holding since July 14th was broken decisively, shown with dashed blue trendline.
2) The formation of h&s was an alert to the fact that market is topping and wave (B) of 3 of c of (I) was actually a perfect retest of the neckline of the h&s.

إخلاء المسؤولية
لا يُقصد بالمعلومات والمنشورات أن تكون، أو تشكل، أي نصيحة مالية أو استثمارية أو تجارية أو أنواع أخرى من النصائح أو التوصيات المقدمة أو المعتمدة من TradingView. اقرأ المزيد في شروط الاستخدام.
إخلاء المسؤولية
لا يُقصد بالمعلومات والمنشورات أن تكون، أو تشكل، أي نصيحة مالية أو استثمارية أو تجارية أو أنواع أخرى من النصائح أو التوصيات المقدمة أو المعتمدة من TradingView. اقرأ المزيد في شروط الاستخدام.