
MARKET OVERVIEW: Key Highlights of the Day
Investor sentiment remained resilient as equity markets advanced ahead of a holiday-shortened trading week, with large-cap technology and AI-related stocks driving the momentum. This robust performance sets a positive tone as we approach year-end. Notably, hard assets, particularly gold and silver, displayed continued strength, indicating that investors are still seeking hedges amid a rising equity environment. Meanwhile, oil prices remain sensitive to geopolitical developments. Interest rates held steady without causing significant disruptions.
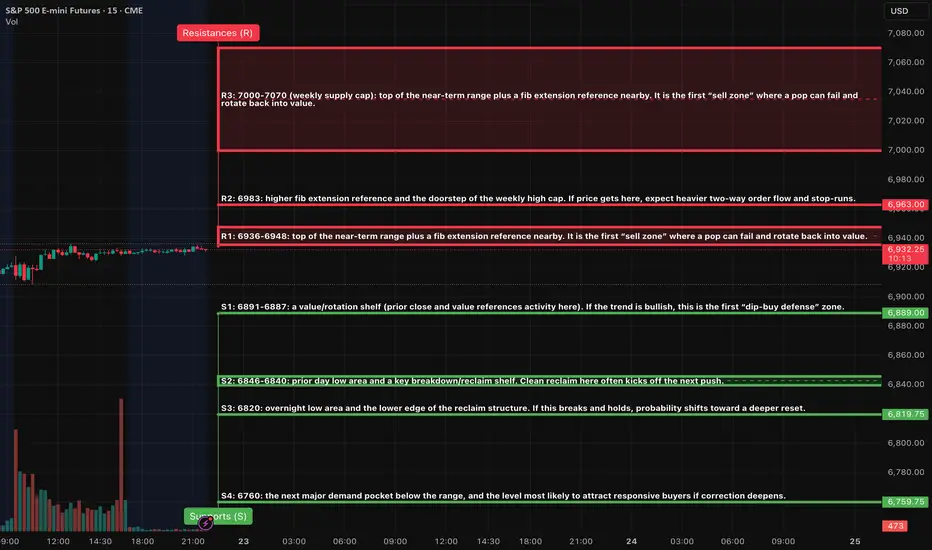
For the E-mini S&P 500 (ES), the overarching trend remains upward; however, the holiday trading environment can lead to choppy price movements. Currently, the ES is testing the upper boundary of its range, making this nearby resistance level a critical point to watch as we progress into overnight trading and the New York session.
Nvidia's stock rose over 1% following a Reuters report indicating that the company plans to start shipping its H200 chips to China by mid-February. Micron Technology experienced a surge of approximately 4%, while Oracle's shares climbed more than 3%. This movement underscores Nvidia’s profound impact, as it now makes up a remarkable 8% of the S&P 500, marking the highest concentration for a single stock in over fifty years. Institutional investment flows continue to be fueled by ongoing developments in AI infrastructure.
The Federal Reserve concluded its December meeting with a 25 basis point reduction in the federal funds rate, adjusting it to a range of 3.50% to 3.75%. This marks the third consecutive rate cut, bringing rates to their lowest since November 2022. Notably, the committee exhibited a divide, with three members dissenting against the cut, reflecting the most disagreement since September 2019. The updated "dot plot" suggests only one additional 25 basis point cut in 2026, followed by another in 2027.
Equity markets have successfully recovered their December losses, positioning the S&P 500 for what could be its eighth consecutive month of gains, the longest winning streak since 2018. On Monday, nearly 400 stocks within the index posted gains as it approached record highs. Historically, the so-called Santa Claus rally has yielded positive results about 80% of the time, averaging a gain of 1.6% since 1928.
TOMORROW - EVENTS TO RESPECT (ET)
08:30 - GDP (Q3 estimate) + Corporate Profits
08:30 - Durable Goods (advance report)
10:00 - Consumer Confidence
10:00 - New Home Sales
16:30 - API crude oil inventory
Liquidity note: shortened week continues - moves can be sharp, then stall quickly.
NY PATH MAP: Overnight Analysis
The market is expected to navigate a range between 6908.50 and 6948.25. Notably, the “gravity pocket” is identified around the 6929.75 to 6925.75 range. Maintaining a position above 6920.50 is crucial for sustaining a bullish outlook. However, a decisive move between 6936.25 and 6948.25 would likely pave the way toward a target of 6983.00.
Bullish Scenario: For a bullish trajectory, it is imperative for the market to defend the 6920.50 level during the Asian and London trading sessions. A successful reclaim and sustain above 6948.25 in New York would open possibilities for a push towards 6983.00, with 7000.00 serving as an upper stretch target.
Bearish Scenario: On the downside, a rejection within the 6936.25 to 6948.25 range, coupled with a drop below 6908.50, would shift the odds in favor of a move towards 6891.00 to 6887.00. Continued selling pressure could then target levels between 6846.00 and 6840.00.
A++ SETUPS (Level-KZ 15/5/1 execution, two plays only)
A++ SETUP 1 - LONG - Break and hold above R1 (pop-and-go)
15m trigger: full body close above 6948.25
5m confirm: pullback holds 6948.25 and re-closes back above it
1m entry: buy 6946.75 to 6948.25 on the first pullback after the hold is proven
Hard SL: 6935.75
TP1: 6983.00
TP2: 7000.00
TP3: 7070.00
A++ SETUP 2 - SHORT - Rejection from R1 (pop-and-fail)
15m trigger: push into 6936.25 to 6948.25, then 15m close back below 6936.25
5m confirm: re-test of 6933.50 to 6936.25 fails and 5m re-closes lower
1m entry: sell 6932.75 to 6934.25 on the first lower-high after the failure is proven
Hard SL: 6949.75
TP1: 6889.00 (middle of S1)
TP2: 6846.00
TP3: 6820.00
If you enjoy our analysis, please consider boosting and sharing our post.
Good Luck !!!
Investor sentiment remained resilient as equity markets advanced ahead of a holiday-shortened trading week, with large-cap technology and AI-related stocks driving the momentum. This robust performance sets a positive tone as we approach year-end. Notably, hard assets, particularly gold and silver, displayed continued strength, indicating that investors are still seeking hedges amid a rising equity environment. Meanwhile, oil prices remain sensitive to geopolitical developments. Interest rates held steady without causing significant disruptions.
For the E-mini S&P 500 (ES), the overarching trend remains upward; however, the holiday trading environment can lead to choppy price movements. Currently, the ES is testing the upper boundary of its range, making this nearby resistance level a critical point to watch as we progress into overnight trading and the New York session.
Nvidia's stock rose over 1% following a Reuters report indicating that the company plans to start shipping its H200 chips to China by mid-February. Micron Technology experienced a surge of approximately 4%, while Oracle's shares climbed more than 3%. This movement underscores Nvidia’s profound impact, as it now makes up a remarkable 8% of the S&P 500, marking the highest concentration for a single stock in over fifty years. Institutional investment flows continue to be fueled by ongoing developments in AI infrastructure.
The Federal Reserve concluded its December meeting with a 25 basis point reduction in the federal funds rate, adjusting it to a range of 3.50% to 3.75%. This marks the third consecutive rate cut, bringing rates to their lowest since November 2022. Notably, the committee exhibited a divide, with three members dissenting against the cut, reflecting the most disagreement since September 2019. The updated "dot plot" suggests only one additional 25 basis point cut in 2026, followed by another in 2027.
Equity markets have successfully recovered their December losses, positioning the S&P 500 for what could be its eighth consecutive month of gains, the longest winning streak since 2018. On Monday, nearly 400 stocks within the index posted gains as it approached record highs. Historically, the so-called Santa Claus rally has yielded positive results about 80% of the time, averaging a gain of 1.6% since 1928.
TOMORROW - EVENTS TO RESPECT (ET)
08:30 - GDP (Q3 estimate) + Corporate Profits
08:30 - Durable Goods (advance report)
10:00 - Consumer Confidence
10:00 - New Home Sales
16:30 - API crude oil inventory
Liquidity note: shortened week continues - moves can be sharp, then stall quickly.
NY PATH MAP: Overnight Analysis
The market is expected to navigate a range between 6908.50 and 6948.25. Notably, the “gravity pocket” is identified around the 6929.75 to 6925.75 range. Maintaining a position above 6920.50 is crucial for sustaining a bullish outlook. However, a decisive move between 6936.25 and 6948.25 would likely pave the way toward a target of 6983.00.
Bullish Scenario: For a bullish trajectory, it is imperative for the market to defend the 6920.50 level during the Asian and London trading sessions. A successful reclaim and sustain above 6948.25 in New York would open possibilities for a push towards 6983.00, with 7000.00 serving as an upper stretch target.
Bearish Scenario: On the downside, a rejection within the 6936.25 to 6948.25 range, coupled with a drop below 6908.50, would shift the odds in favor of a move towards 6891.00 to 6887.00. Continued selling pressure could then target levels between 6846.00 and 6840.00.
A++ SETUPS (Level-KZ 15/5/1 execution, two plays only)
A++ SETUP 1 - LONG - Break and hold above R1 (pop-and-go)
15m trigger: full body close above 6948.25
5m confirm: pullback holds 6948.25 and re-closes back above it
1m entry: buy 6946.75 to 6948.25 on the first pullback after the hold is proven
Hard SL: 6935.75
TP1: 6983.00
TP2: 7000.00
TP3: 7070.00
A++ SETUP 2 - SHORT - Rejection from R1 (pop-and-fail)
15m trigger: push into 6936.25 to 6948.25, then 15m close back below 6936.25
5m confirm: re-test of 6933.50 to 6936.25 fails and 5m re-closes lower
1m entry: sell 6932.75 to 6934.25 on the first lower-high after the failure is proven
Hard SL: 6949.75
TP1: 6889.00 (middle of S1)
TP2: 6846.00
TP3: 6820.00
If you enjoy our analysis, please consider boosting and sharing our post.
Good Luck !!!

info@algoindex.com, algoindex.com | Join our free trading community: facebook.com/groups/1256769122661043
إخلاء المسؤولية
لا يُقصد بالمعلومات والمنشورات أن تكون، أو تشكل، أي نصيحة مالية أو استثمارية أو تجارية أو أنواع أخرى من النصائح أو التوصيات المقدمة أو المعتمدة من TradingView. اقرأ المزيد في شروط الاستخدام.
info@algoindex.com, algoindex.com | Join our free trading community: facebook.com/groups/1256769122661043
إخلاء المسؤولية
لا يُقصد بالمعلومات والمنشورات أن تكون، أو تشكل، أي نصيحة مالية أو استثمارية أو تجارية أو أنواع أخرى من النصائح أو التوصيات المقدمة أو المعتمدة من TradingView. اقرأ المزيد في شروط الاستخدام.