
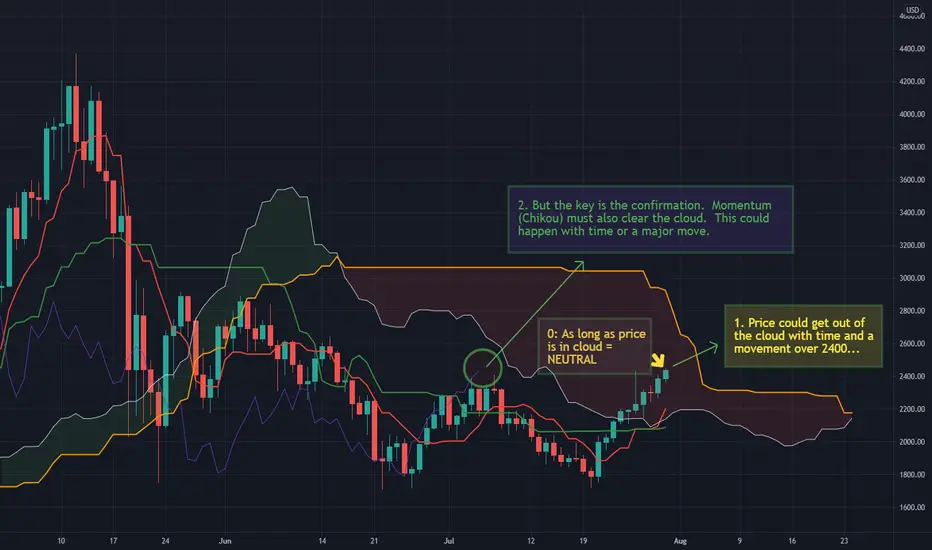
I have gotten this question frequently. When I want to forecast a chart as bullish or bearish I rely on Ichimoku Trend Analysis. There are two basic components that I look for:
0: A basic rule of Ichimoku is that when price is within the Kumo cloud the sentiment is neutral.
1: When price gets above the cloud = Bullish; price below the cloud = Bearish. This is the fundamental basis of Ichimoku Trend Analysis. But there is one more important confirmation tool...
2. Chikou, the "Lagging Span", or sometimes called "Momentum" follows price. It also must get out of the cloud to CONFIRM the trend. This is important for filtering out false breakouts.
When both price and momentum are out of the cloud you have confirmation of a bullish trend. This can happen naturally with time passing as price and momentum move across the cloud from left to right. This can also happen with a fast move to allow momentum to completely clear the cloud.
Research for yourself... go back on a DAILY chart of any instrument and see for yourself how well a true trend relates to the Ichimoku cloud and how when price crosses the cloud Momentum becomes a check to prevent false breakouts.
Tomorrow (Fridays) at 4pm Eastern I will be doing my regular weekly Livestream here on Tradingview. I am going to go through a lesson on this concept using various examples. Be sure to check it out Live to ask questions or it will be recorded for later.
0: A basic rule of Ichimoku is that when price is within the Kumo cloud the sentiment is neutral.
1: When price gets above the cloud = Bullish; price below the cloud = Bearish. This is the fundamental basis of Ichimoku Trend Analysis. But there is one more important confirmation tool...
2. Chikou, the "Lagging Span", or sometimes called "Momentum" follows price. It also must get out of the cloud to CONFIRM the trend. This is important for filtering out false breakouts.
When both price and momentum are out of the cloud you have confirmation of a bullish trend. This can happen naturally with time passing as price and momentum move across the cloud from left to right. This can also happen with a fast move to allow momentum to completely clear the cloud.
Research for yourself... go back on a DAILY chart of any instrument and see for yourself how well a true trend relates to the Ichimoku cloud and how when price crosses the cloud Momentum becomes a check to prevent false breakouts.
Tomorrow (Fridays) at 4pm Eastern I will be doing my regular weekly Livestream here on Tradingview. I am going to go through a lesson on this concept using various examples. Be sure to check it out Live to ask questions or it will be recorded for later.

"Be to others the person you needed to meet 10 years ago"
Discord Trading Community: discord.gg/eDfhKvS5AC
Youtube: youtube.com/c/NoroksNotepad
Twitter: twitter.com/noroktrade
Discord Trading Community: discord.gg/eDfhKvS5AC
Youtube: youtube.com/c/NoroksNotepad
Twitter: twitter.com/noroktrade
إخلاء المسؤولية
لا يُقصد بالمعلومات والمنشورات أن تكون، أو تشكل، أي نصيحة مالية أو استثمارية أو تجارية أو أنواع أخرى من النصائح أو التوصيات المقدمة أو المعتمدة من TradingView. اقرأ المزيد في شروط الاستخدام.
"Be to others the person you needed to meet 10 years ago"
Discord Trading Community: discord.gg/eDfhKvS5AC
Youtube: youtube.com/c/NoroksNotepad
Twitter: twitter.com/noroktrade
Discord Trading Community: discord.gg/eDfhKvS5AC
Youtube: youtube.com/c/NoroksNotepad
Twitter: twitter.com/noroktrade
إخلاء المسؤولية
لا يُقصد بالمعلومات والمنشورات أن تكون، أو تشكل، أي نصيحة مالية أو استثمارية أو تجارية أو أنواع أخرى من النصائح أو التوصيات المقدمة أو المعتمدة من TradingView. اقرأ المزيد في شروط الاستخدام.