
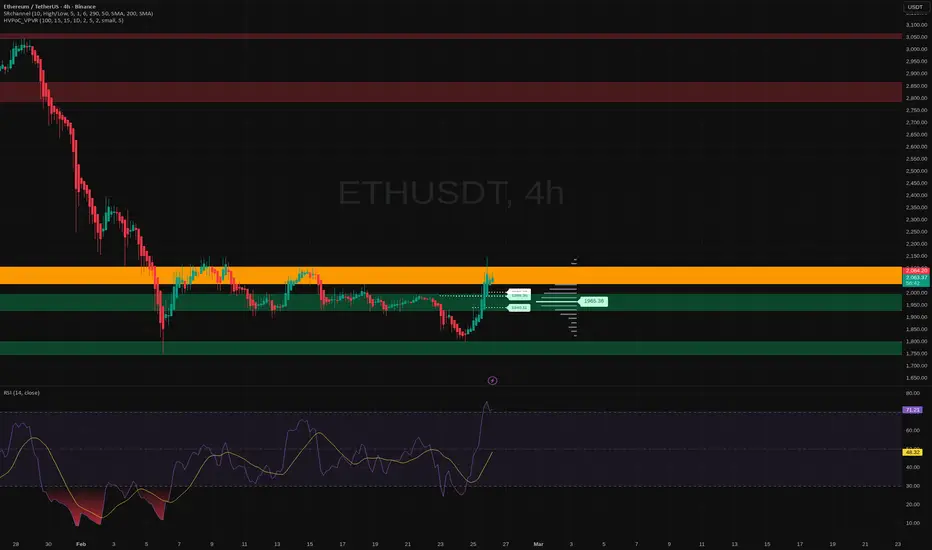
Let’s talk about trendlines on alts – the thing everyone draws, almost nobody respects, and the market loves to bully.
Alts are noisy. Wicks everywhere, liquidity thin, random 20% candles on a Tuesday night. If you draw trendlines on them the same way you do on BTC, you’ll constantly scream: “Fake breakout!” when in reality your line was trash.
Here’s how I treat trendlines on altcoins so they actually mean something.
1) Touches: 2 points start a line, 3 points make it real
I only take a trendline seriously after the third touch.
First 2 touches are just geometry. The 3rd is the market saying: “Yep, we see this too.”
On alts, I like:
- For support in an uptrend: at least 3 wick touches with bodies mostly above.
- For resistance in a downtrend: at least 3 touches with bodies mostly below.
One random wick hitting your line is not “respecting the trendline”, it’s just the market doing cardio.
2) Angle: if it’s too steep, it’s not a trend, it’s a chase
If your trendline looks almost vertical, you don’t have a trend – you have FOMO on a stick.
Rough logic I use:
- Slow, chill angle: often sustainable, good for swing trading.
- Medium angle: still fine, but I expect a sharper correction on break.
- Near vertical: I assume it breaks sooner rather than later and I don’t marry it.
On alts, I try to anchor trendlines from calm areas, not from the absolute bottom wick of some liquidation nuke. If the move started with a crazy V-shape candle, I usually ignore that wick and use the next swing low/high. Otherwise the line angle becomes insane and absolutely everything looks like a fake break.
3) Fake pokes: when price “breaks” but doesn’t really
Alts love fakeouts. You’ll see price pierce the trendline, everyone panics, then it closes right back above or below like nothing happened.
How I filter the noise:
- I trust candle closes, not just wicks
On higher timeframes (4H and up), if price wicks through the trendline but closes back inside, I often treat it as:
- A stop hunt
- A liquidity grab
- A “poke” to clean overleveraged positions
- Time spent outside the line
If price breaks the trendline but spends only one candle outside then instantly reclaims it on the next, that’s suspect. Real breaks usually:
- Hold outside the line
- Retest it from the other side
- Then continue
- Volume check
Clean break: often comes with strong volume and follow through.
Fake poke: sudden spike, no continuation, price drifts back into the old range.
4) Trendline “validity” checklist I quietly run in my head
- Is it drawn on a meaningful timeframe?
5 min trendlines on alts die faster than your patience. I prefer 1H, 4H, daily to define the main structure.
- Did I cherry pick points?
If I had to force the line so it fits my bias, it’s not a line, it’s fan fiction.
- Do other people likely see the same line?
The best trendlines are the obvious ones. If you need 10 zoom levels and a ruler to notice it, probably only you care.
Maybe I’m wrong, but most people don’t lose money because “trendlines don’t work” – they lose because they call every random diagonal on a 15 min alt chart a “trendline break”.
Last thing: a trendline is not a religion. It’s a guide. On alts, I use them as context:
- Confluence with support/resistance
- Confluence with a range high/low
- Confluence with volume zones
One trendline alone won’t make you rich. But a clean, respected line, with proper touches, sane angle, and awareness of fake pokes – that’s already a big step up from drawing diagonals just because the chart looks empty.
Alts are noisy. Wicks everywhere, liquidity thin, random 20% candles on a Tuesday night. If you draw trendlines on them the same way you do on BTC, you’ll constantly scream: “Fake breakout!” when in reality your line was trash.
Here’s how I treat trendlines on altcoins so they actually mean something.
1) Touches: 2 points start a line, 3 points make it real
I only take a trendline seriously after the third touch.
First 2 touches are just geometry. The 3rd is the market saying: “Yep, we see this too.”
On alts, I like:
- For support in an uptrend: at least 3 wick touches with bodies mostly above.
- For resistance in a downtrend: at least 3 touches with bodies mostly below.
One random wick hitting your line is not “respecting the trendline”, it’s just the market doing cardio.
2) Angle: if it’s too steep, it’s not a trend, it’s a chase
If your trendline looks almost vertical, you don’t have a trend – you have FOMO on a stick.
Rough logic I use:
- Slow, chill angle: often sustainable, good for swing trading.
- Medium angle: still fine, but I expect a sharper correction on break.
- Near vertical: I assume it breaks sooner rather than later and I don’t marry it.
On alts, I try to anchor trendlines from calm areas, not from the absolute bottom wick of some liquidation nuke. If the move started with a crazy V-shape candle, I usually ignore that wick and use the next swing low/high. Otherwise the line angle becomes insane and absolutely everything looks like a fake break.
3) Fake pokes: when price “breaks” but doesn’t really
Alts love fakeouts. You’ll see price pierce the trendline, everyone panics, then it closes right back above or below like nothing happened.
How I filter the noise:
- I trust candle closes, not just wicks
On higher timeframes (4H and up), if price wicks through the trendline but closes back inside, I often treat it as:
- A stop hunt
- A liquidity grab
- A “poke” to clean overleveraged positions
- Time spent outside the line
If price breaks the trendline but spends only one candle outside then instantly reclaims it on the next, that’s suspect. Real breaks usually:
- Hold outside the line
- Retest it from the other side
- Then continue
- Volume check
Clean break: often comes with strong volume and follow through.
Fake poke: sudden spike, no continuation, price drifts back into the old range.
4) Trendline “validity” checklist I quietly run in my head
- Is it drawn on a meaningful timeframe?
5 min trendlines on alts die faster than your patience. I prefer 1H, 4H, daily to define the main structure.
- Did I cherry pick points?
If I had to force the line so it fits my bias, it’s not a line, it’s fan fiction.
- Do other people likely see the same line?
The best trendlines are the obvious ones. If you need 10 zoom levels and a ruler to notice it, probably only you care.
Maybe I’m wrong, but most people don’t lose money because “trendlines don’t work” – they lose because they call every random diagonal on a 15 min alt chart a “trendline break”.
Last thing: a trendline is not a religion. It’s a guide. On alts, I use them as context:
- Confluence with support/resistance
- Confluence with a range high/low
- Confluence with volume zones
One trendline alone won’t make you rich. But a clean, respected line, with proper touches, sane angle, and awareness of fake pokes – that’s already a big step up from drawing diagonals just because the chart looks empty.

SIGNAL INDICATOR
NO REDESIGNING
✅Buy&Sell according to 7 strategies
✅Technical analysis according to 30+ parameters
✅WinRate of signals up to 75%
✅RR 1k3, no deep drawdowns!
Free test drive using my link:
👉t.me/Multiindicator_bot
NO REDESIGNING
✅Buy&Sell according to 7 strategies
✅Technical analysis according to 30+ parameters
✅WinRate of signals up to 75%
✅RR 1k3, no deep drawdowns!
Free test drive using my link:
👉t.me/Multiindicator_bot
منشورات ذات صلة
إخلاء المسؤولية
لا يُقصد بالمعلومات والمنشورات أن تكون، أو تشكل، أي نصيحة مالية أو استثمارية أو تجارية أو أنواع أخرى من النصائح أو التوصيات المقدمة أو المعتمدة من TradingView. اقرأ المزيد في شروط الاستخدام.
SIGNAL INDICATOR
NO REDESIGNING
✅Buy&Sell according to 7 strategies
✅Technical analysis according to 30+ parameters
✅WinRate of signals up to 75%
✅RR 1k3, no deep drawdowns!
Free test drive using my link:
👉t.me/Multiindicator_bot
NO REDESIGNING
✅Buy&Sell according to 7 strategies
✅Technical analysis according to 30+ parameters
✅WinRate of signals up to 75%
✅RR 1k3, no deep drawdowns!
Free test drive using my link:
👉t.me/Multiindicator_bot
منشورات ذات صلة
إخلاء المسؤولية
لا يُقصد بالمعلومات والمنشورات أن تكون، أو تشكل، أي نصيحة مالية أو استثمارية أو تجارية أو أنواع أخرى من النصائح أو التوصيات المقدمة أو المعتمدة من TradingView. اقرأ المزيد في شروط الاستخدام.