
Ethereum (ETH) technical analysis:
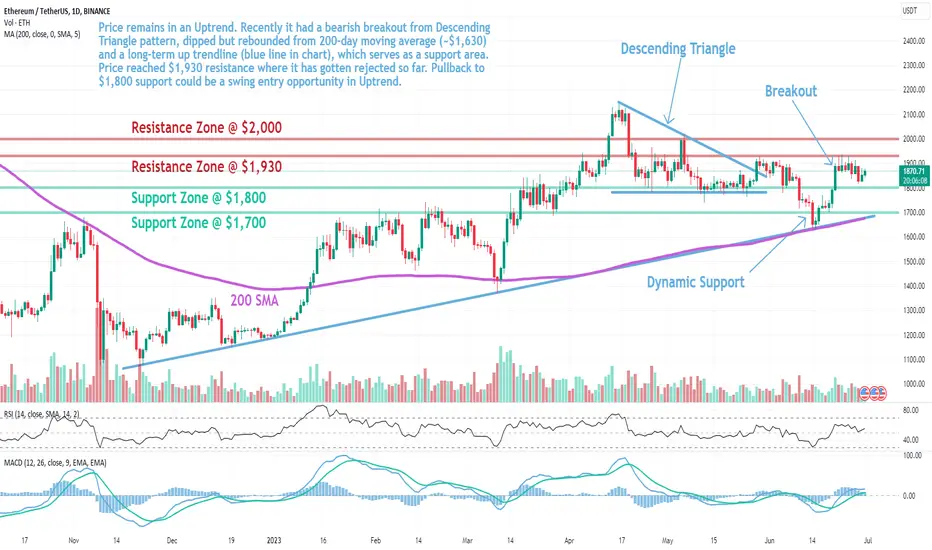
Trade setup: Price remains in an Uptrend. Recently it had a bearish breakout from Descending Triangle pattern, dipped but rebounded from 200-day moving average (~$1,630) and a long-term up trendline (blue line in chart), which serves as a support area. Price reached $1,930 resistance where it has gotten rejected so far. Pullback to $1,800 support could be a swing entry opportunity in Uptrend.
Trend: Uptrend on Short- and Medium-Term basis and Neutral on Long-Term basis.
Momentum is Mixed as MACD Line is above MACD Signal Line (Bullish) but RSI ~ 50 (Neutral). MACD Histogram bars are declining, which suggests that momentum is weakening.
Support and Resistance: Nearest Support Zone is $1,800 (previous resistance), then $1,700. The nearest Resistance Zone is $1,930, then $2,000.
Trade setup: Price remains in an Uptrend. Recently it had a bearish breakout from Descending Triangle pattern, dipped but rebounded from 200-day moving average (~$1,630) and a long-term up trendline (blue line in chart), which serves as a support area. Price reached $1,930 resistance where it has gotten rejected so far. Pullback to $1,800 support could be a swing entry opportunity in Uptrend.
Trend: Uptrend on Short- and Medium-Term basis and Neutral on Long-Term basis.
Momentum is Mixed as MACD Line is above MACD Signal Line (Bullish) but RSI ~ 50 (Neutral). MACD Histogram bars are declining, which suggests that momentum is weakening.
Support and Resistance: Nearest Support Zone is $1,800 (previous resistance), then $1,700. The nearest Resistance Zone is $1,930, then $2,000.

إخلاء المسؤولية
لا يُقصد بالمعلومات والمنشورات أن تكون، أو تشكل، أي نصيحة مالية أو استثمارية أو تجارية أو أنواع أخرى من النصائح أو التوصيات المقدمة أو المعتمدة من TradingView. اقرأ المزيد في شروط الاستخدام.
إخلاء المسؤولية
لا يُقصد بالمعلومات والمنشورات أن تكون، أو تشكل، أي نصيحة مالية أو استثمارية أو تجارية أو أنواع أخرى من النصائح أو التوصيات المقدمة أو المعتمدة من TradingView. اقرأ المزيد في شروط الاستخدام.