
Ethereum (ETH) technical analysis:
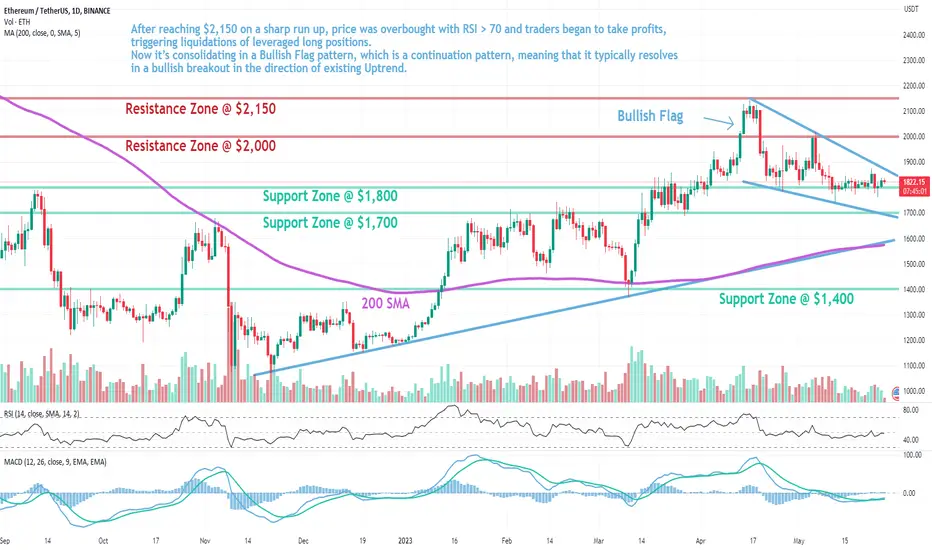
Trade setup: After reaching $2,150 on a sharp run up, price was overbought with RSI > 70 and traders began to take profits, triggering liquidations of leveraged long positions. Now it’s consolidating in a Bullish Flag pattern, which is a continuation pattern, meaning that it typically resolves in a bullish breakout in the direction of existing Uptrend.
Pattern: Bullish Flag pattern. Short term small rectangle trading range between diagonal parallel lines. It moves counter to the prevailing price trend observed in a longer time frame on a price chart. It forms typically following a sharp advance and often indicates a small change in direction (or areas of consolidation) before the previous trend resumes. Flag pattern is among the most reliable continuation patterns that traders use because it generates a setup for entering an existing trend that is ready to continue. Trade is initiated on a breakout, if it is in the same direction as the prevailing trend. Also, with bullish flag patterns, traders prefer a breakout with an increase in volume but it isn’t a must.
Trend: Neutral on Medium-Term basis and Uptrend on Short- and Long-Term basis.
Momentum is Mixed as MACD Line is above MACD Signal Line (Bullish) but RSI ~ 50 (Neutral).
Support and Resistance: Nearest Support Zone is $1,800, then $1,700, and $1,400. The nearest Resistance Zone is $2,000 (previous support), then $2,150.
Trade setup: After reaching $2,150 on a sharp run up, price was overbought with RSI > 70 and traders began to take profits, triggering liquidations of leveraged long positions. Now it’s consolidating in a Bullish Flag pattern, which is a continuation pattern, meaning that it typically resolves in a bullish breakout in the direction of existing Uptrend.
Pattern: Bullish Flag pattern. Short term small rectangle trading range between diagonal parallel lines. It moves counter to the prevailing price trend observed in a longer time frame on a price chart. It forms typically following a sharp advance and often indicates a small change in direction (or areas of consolidation) before the previous trend resumes. Flag pattern is among the most reliable continuation patterns that traders use because it generates a setup for entering an existing trend that is ready to continue. Trade is initiated on a breakout, if it is in the same direction as the prevailing trend. Also, with bullish flag patterns, traders prefer a breakout with an increase in volume but it isn’t a must.
Trend: Neutral on Medium-Term basis and Uptrend on Short- and Long-Term basis.
Momentum is Mixed as MACD Line is above MACD Signal Line (Bullish) but RSI ~ 50 (Neutral).
Support and Resistance: Nearest Support Zone is $1,800, then $1,700, and $1,400. The nearest Resistance Zone is $2,000 (previous support), then $2,150.

إخلاء المسؤولية
لا يُقصد بالمعلومات والمنشورات أن تكون، أو تشكل، أي نصيحة مالية أو استثمارية أو تجارية أو أنواع أخرى من النصائح أو التوصيات المقدمة أو المعتمدة من TradingView. اقرأ المزيد في شروط الاستخدام.
إخلاء المسؤولية
لا يُقصد بالمعلومات والمنشورات أن تكون، أو تشكل، أي نصيحة مالية أو استثمارية أو تجارية أو أنواع أخرى من النصائح أو التوصيات المقدمة أو المعتمدة من TradingView. اقرأ المزيد في شروط الاستخدام.