

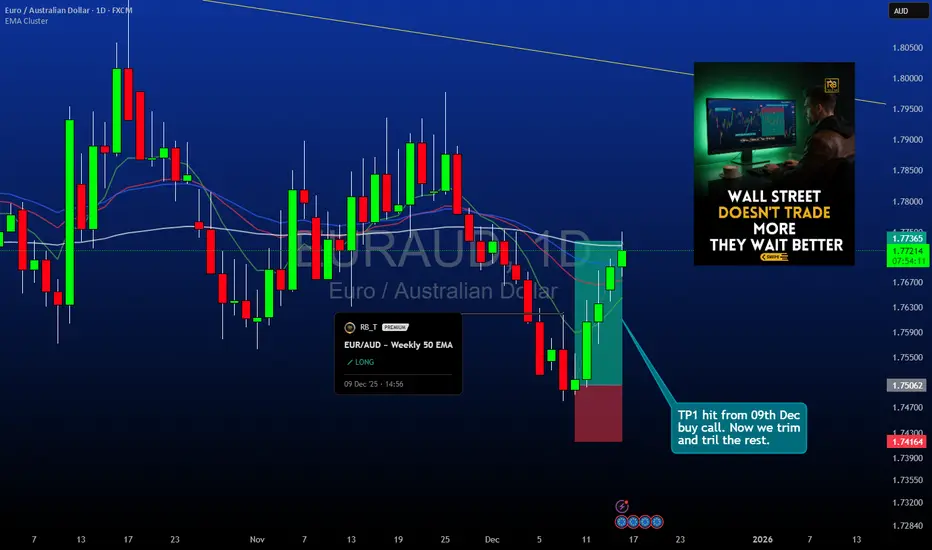
EUR/AUD Weekly Setup Delivers: TP1 Reached, Structure Based Reversal Confirming
Our weekly 50 EMA bounce setup on EUR/AUD is now validating with TP1 achieved. Price respected the dynamic support precisely as anticipated, reversing from the weekly moving average and advancing toward the projected swing high targets.
This update examines the progression since the original call, current price action development, and management strategy for the remaining position.
📊 Original Setup Recap:
What We Identified:
EUR/AUD had pulled back to test the weekly 50 EMA after an extended uptrend. The setup featured:
Weekly 50 EMA dynamic support acting as trend inflection point
Multi-week correction showing signs of exhaustion
Structure confluence with previous consolidation zone
Clear risk definition below recent wick lows
The Call:
Long position at weekly 50 EMA with 3R upside potential toward previous swing highs. Entry around 1.7500 area with stop below the EMA test zone.
Why It Mattered:
Weekly timeframe setups filter out noise and capture institutional positioning. When a strong trend corrects to the weekly 50 EMA with structure intact, probability favors continuation over reversal.
📈 What Happened: TP1 Achievement
Price Action Validation:
Following the weekly 50 EMA test, EUR/AUD has:
✅ Held support: Wick lows at the EMA were not violated
✅ Formed higher lows: Price structure showing bullish characteristics
✅ Advanced with momentum: Consistent green weekly candles post-bounce
✅ Reached TP1: First target zone achieved as projected
Current Status:
Entry area: ~1.7500 (weekly 50 EMA)
TP1 achieved: First target hit
Remaining targets: Swing highs still in play
Stop management: Original risk now eliminated for scaled position
Key Observation:
The bounce from the weekly 50 EMA occurred with precision. No breakdown, no false starts - just clean technical execution. This is textbook weekly timeframe structure playing out as the setup suggested.
🎯 From Weekly EMA to TP1: The Progression
Week 1-2 (Setup Phase):
Price tested weekly 50 EMA
Demand began appearing with longer lower wicks
Volume contraction signaling selling exhaustion
Entry opportunity at dynamic support
Week 3-4 (Confirmation Phase):
Price closed back above the weekly 50 EMA
Higher lows establishing on weekly chart
Momentum indicators shifting bullish
Early validation of the reversal thesis
Week 5-6 (Advancement Phase - Current):
Consistent upward progress toward targets
TP1 zone reached
Structure building as anticipated
Remaining upside to swing highs still available
What This Teaches:
Weekly setups require patience. The move from EMA touch to TP1 took several weeks - not days. Traders who entered at the weekly 50 EMA and held through minor consolidations are now rewarded with the first target achievement.
📊 Technical Update:
Weekly Chart Structure:
Trend: Uptrend fully re-established after EMA bounce
Support: Weekly 50 EMA now acting as trailing support
Resistance: Approaching previous swing high zone
Momentum: RSI in healthy bullish territory (55-65 range)
What Changed:
Before: Price testing support, uncertainty about reversal
Now: Support held, TP1 achieved, uptrend confirmed
Structure: Higher lows pattern locked in on weekly chart
Key Levels:
Support: 1.7500 (weekly 50 EMA - original entry)
TP1: ✅ Achieved (first profit-taking zone)
TP2: 1.7900 area (intermediate target)
📈 Position Management Framework:
For Those In Since Weekly 50 EMA:
TP1 Achieved - First Reduction:
Lock in guaranteed profit
Remove emotional pressure
Allow remaining position to run toward higher targets
Convert to "risk-free" trade psychologically
Current Strategy:
Sold 70%: ✅ Profit secured at TP1
Holding 30%: Targeting TP2 (1.7900)
Stop adjustment: Move to breakeven or trail below weekly swing lows
Scaling Plan:
TP1 (Current): Reduce 70% ✅
TP2 (~1.7900): Reduce another 1/3 (30% of original gone)
Stop Management:
Original stop: Below 1.7400 (weekly wick low)
Updated stop: Can now move to 1.7500 (breakeven) since TP1 hit
Trailing approach: Keep stop below most recent weekly swing low
Final stage: Trail tightly as TP3 zone approaches
🧠 Psychology of Scaling vs. Holding:
The Temptation at TP1:
Many traders feel the urge to close the entire position when the first target hits:
"I've made good profit, what if it reverses?"
"Better to take guaranteed money now"
"TP1 is hit, mission accomplished"
Why Scaling is Superior:
TP1 was only 1R of the projected 3R move
Closing everything captures 33% of the potential
Original thesis suggested swing highs (TP3) as the structural target
Weekly setups often deliver all targets when structure is respected
The Professional Approach:
By taking 1/3 at TP1:
Profit is locked (removes fear of giving it back)
Remaining 2/3 can capture TP2 and TP3
Stop at breakeven means no risk on remaining position
Psychology shifts from "hoping" to "managing a winner"
📅 What's Next: Path to TP2 and TP3
Remaining Upside:
From current TP1 level:
To TP2 (1.7900): Additional ~100-150 pips
Timeframe: Likely 2 more weeks to full target achievement
Expected Behavior:
Consolidation likely: Brief sideways action before next leg
Weekly structure: Should continue showing higher lows
Momentum: May see minor pullbacks on daily chart while weekly stays bullish
Volume: Expansion near resistance zones typical
Bullish Scenario:
Price consolidates briefly at TP1
Breaks through TP2 with momentum
Reaches previous swing highs at TP3
Completes full 3R target as projected
Neutral Scenario:
Extended consolidation between TP1 and TP2
Requires additional weeks to build energy
Eventually resolves higher but slower than expected
Still reaches targets, just takes more time
Bearish Scenario (Invalidation):
Weekly close back below 50 EMA (1.7500)
Break of recent weekly swing low
Signals trend exhaustion and requires exit
With stop at breakeven, this results in small gain overall (TP1 already banked)
📊 Why This Setup Worked:
Technical Factors:
✅ Weekly 50 EMA is a proven level - historical significance
✅ Uptrend structure remained intact - no broken support
✅ Correction showed exhaustion - volume and momentum aligned
✅ Clear risk/reward - defined stop, multiple targets
Psychological Factors:
Most traders feared entering during the pullback
Weekly corrections "feel" like trend failure
Entry at support felt uncomfortable - that's when it works
By the time TP1 hit, many wish they'd entered at the EMA
Timeframe Advantage:
Weekly charts remove intraday noise
Institutional positioning more visible on higher timeframes
Patience required but payoff is substantial
One well-executed weekly setup can outperform dozens of intraday trades
🎯 Lessons from This Trade:
✅ Weekly timeframes work: Patient positioning at key EMAs pays off
✅ Structure over emotion: The EMA bounce "felt" risky but structure suggested otherwise
✅ Scaling captures more: Taking 1/3 at TP1 allows 2/3 to ride to higher targets
✅ Stops protect capital: Clear invalidation below EMA meant defined risk
✅ Patience is profit: Multi-week hold required but 3R potential justified the wait
✅ Let winners run: TP1 is just the first milestone, not the exit point
📌 Current Trade Summary:
Entry: ~1.7500 (weekly 50 EMA) ✅
TP1: Achieved ✅ (70% position closed)
TP2: ~1.7900 (pending)
Stop: Moved to breakeven (1.7500)
Risk: None (TP1 profit locked, stop at entry)
Remaining Upside: 2R+ to final targets
Status: Trade is working exactly as the weekly structure suggested. First target achieved validates the entry thesis. Remaining position has zero risk with 2R+ upside still available.
🏆 Professional Execution Checklist:
✅ Identified weekly structure (50 EMA support)
✅ Entered at optimal risk point (dynamic support)
✅ Held through consolidation (patience during position development)
✅ Took profits at TP1 (scaled 1/3 off)
✅ Moved stop to breakeven (eliminated remaining risk)
✅ Holding for TP2/TP3 (letting winners run)
This is textbook position management: structure-based entry, defined risk, systematic scaling, and allowing the weekly timeframe thesis to fully develop.
⚠️ What Could Still Go Wrong:
Reversal at Resistance:
TP2 or TP3 zones could reject price strongly. This is why we scale - TP1 profit is already locked regardless of what happens next.
Weekly Close Below 50 EMA:
If price reverses hard and closes back below 1.7500 on a weekly basis, the trend assumption is invalidated. With stop at breakeven, this results in flat or small profit (TP1 gain minus any slippage on remaining 2/3).
Fundamental Shifts:
Euro weakness or AUD strength from unexpected fundamental developments could override technical structure.
Extended Consolidation:
Price could sideways-trade for weeks before attempting TP2/TP3, testing patience even with secured TP1 profit.
⚠️ Important Disclaimers:
This is an educational update on a weekly timeframe trade setup. It is not financial advice or a recommendation to buy or sell EUR/AUD or any currency pair.
The trade has achieved TP1 but there is no guarantee TP2 or TP3 will be reached. The remaining position could reverse, consolidate indefinitely, or fail to reach higher targets.
Weekly timeframe trading requires significant patience and tolerance for drawbacks between targets. Past performance (TP1 achievement) does not guarantee continuation to TP2 or TP3.
Position sizing, risk management, and individual trade planning are essential. This update reflects one trader's approach and may not be suitable for all risk tolerances or timeframes.
All forex trading involves substantial risk of loss. Always conduct independent analysis and manage positions according to your own risk parameters.
✨ Community Check-In:
Did you catch the weekly 50 EMA bounce? Are you scaling out at targets or holding full position? How do you manage weekly timeframe trades through consolidation periods? Share your approach in the comments.
📜 Trust the structure. Scale the targets. Manage the risk.
Our weekly 50 EMA bounce setup on EUR/AUD is now validating with TP1 achieved. Price respected the dynamic support precisely as anticipated, reversing from the weekly moving average and advancing toward the projected swing high targets.
This update examines the progression since the original call, current price action development, and management strategy for the remaining position.
📊 Original Setup Recap:
What We Identified:
EUR/AUD had pulled back to test the weekly 50 EMA after an extended uptrend. The setup featured:
Weekly 50 EMA dynamic support acting as trend inflection point
Multi-week correction showing signs of exhaustion
Structure confluence with previous consolidation zone
Clear risk definition below recent wick lows
The Call:
Long position at weekly 50 EMA with 3R upside potential toward previous swing highs. Entry around 1.7500 area with stop below the EMA test zone.
Why It Mattered:
Weekly timeframe setups filter out noise and capture institutional positioning. When a strong trend corrects to the weekly 50 EMA with structure intact, probability favors continuation over reversal.
📈 What Happened: TP1 Achievement
Price Action Validation:
Following the weekly 50 EMA test, EUR/AUD has:
✅ Held support: Wick lows at the EMA were not violated
✅ Formed higher lows: Price structure showing bullish characteristics
✅ Advanced with momentum: Consistent green weekly candles post-bounce
✅ Reached TP1: First target zone achieved as projected
Current Status:
Entry area: ~1.7500 (weekly 50 EMA)
TP1 achieved: First target hit
Remaining targets: Swing highs still in play
Stop management: Original risk now eliminated for scaled position
Key Observation:
The bounce from the weekly 50 EMA occurred with precision. No breakdown, no false starts - just clean technical execution. This is textbook weekly timeframe structure playing out as the setup suggested.
🎯 From Weekly EMA to TP1: The Progression
Week 1-2 (Setup Phase):
Price tested weekly 50 EMA
Demand began appearing with longer lower wicks
Volume contraction signaling selling exhaustion
Entry opportunity at dynamic support
Week 3-4 (Confirmation Phase):
Price closed back above the weekly 50 EMA
Higher lows establishing on weekly chart
Momentum indicators shifting bullish
Early validation of the reversal thesis
Week 5-6 (Advancement Phase - Current):
Consistent upward progress toward targets
TP1 zone reached
Structure building as anticipated
Remaining upside to swing highs still available
What This Teaches:
Weekly setups require patience. The move from EMA touch to TP1 took several weeks - not days. Traders who entered at the weekly 50 EMA and held through minor consolidations are now rewarded with the first target achievement.
📊 Technical Update:
Weekly Chart Structure:
Trend: Uptrend fully re-established after EMA bounce
Support: Weekly 50 EMA now acting as trailing support
Resistance: Approaching previous swing high zone
Momentum: RSI in healthy bullish territory (55-65 range)
What Changed:
Before: Price testing support, uncertainty about reversal
Now: Support held, TP1 achieved, uptrend confirmed
Structure: Higher lows pattern locked in on weekly chart
Key Levels:
Support: 1.7500 (weekly 50 EMA - original entry)
TP1: ✅ Achieved (first profit-taking zone)
TP2: 1.7900 area (intermediate target)
📈 Position Management Framework:
For Those In Since Weekly 50 EMA:
TP1 Achieved - First Reduction:
Lock in guaranteed profit
Remove emotional pressure
Allow remaining position to run toward higher targets
Convert to "risk-free" trade psychologically
Current Strategy:
Sold 70%: ✅ Profit secured at TP1
Holding 30%: Targeting TP2 (1.7900)
Stop adjustment: Move to breakeven or trail below weekly swing lows
Scaling Plan:
TP1 (Current): Reduce 70% ✅
TP2 (~1.7900): Reduce another 1/3 (30% of original gone)
Stop Management:
Original stop: Below 1.7400 (weekly wick low)
Updated stop: Can now move to 1.7500 (breakeven) since TP1 hit
Trailing approach: Keep stop below most recent weekly swing low
Final stage: Trail tightly as TP3 zone approaches
🧠 Psychology of Scaling vs. Holding:
The Temptation at TP1:
Many traders feel the urge to close the entire position when the first target hits:
"I've made good profit, what if it reverses?"
"Better to take guaranteed money now"
"TP1 is hit, mission accomplished"
Why Scaling is Superior:
TP1 was only 1R of the projected 3R move
Closing everything captures 33% of the potential
Original thesis suggested swing highs (TP3) as the structural target
Weekly setups often deliver all targets when structure is respected
The Professional Approach:
By taking 1/3 at TP1:
Profit is locked (removes fear of giving it back)
Remaining 2/3 can capture TP2 and TP3
Stop at breakeven means no risk on remaining position
Psychology shifts from "hoping" to "managing a winner"
📅 What's Next: Path to TP2 and TP3
Remaining Upside:
From current TP1 level:
To TP2 (1.7900): Additional ~100-150 pips
Timeframe: Likely 2 more weeks to full target achievement
Expected Behavior:
Consolidation likely: Brief sideways action before next leg
Weekly structure: Should continue showing higher lows
Momentum: May see minor pullbacks on daily chart while weekly stays bullish
Volume: Expansion near resistance zones typical
Bullish Scenario:
Price consolidates briefly at TP1
Breaks through TP2 with momentum
Reaches previous swing highs at TP3
Completes full 3R target as projected
Neutral Scenario:
Extended consolidation between TP1 and TP2
Requires additional weeks to build energy
Eventually resolves higher but slower than expected
Still reaches targets, just takes more time
Bearish Scenario (Invalidation):
Weekly close back below 50 EMA (1.7500)
Break of recent weekly swing low
Signals trend exhaustion and requires exit
With stop at breakeven, this results in small gain overall (TP1 already banked)
📊 Why This Setup Worked:
Technical Factors:
✅ Weekly 50 EMA is a proven level - historical significance
✅ Uptrend structure remained intact - no broken support
✅ Correction showed exhaustion - volume and momentum aligned
✅ Clear risk/reward - defined stop, multiple targets
Psychological Factors:
Most traders feared entering during the pullback
Weekly corrections "feel" like trend failure
Entry at support felt uncomfortable - that's when it works
By the time TP1 hit, many wish they'd entered at the EMA
Timeframe Advantage:
Weekly charts remove intraday noise
Institutional positioning more visible on higher timeframes
Patience required but payoff is substantial
One well-executed weekly setup can outperform dozens of intraday trades
🎯 Lessons from This Trade:
✅ Weekly timeframes work: Patient positioning at key EMAs pays off
✅ Structure over emotion: The EMA bounce "felt" risky but structure suggested otherwise
✅ Scaling captures more: Taking 1/3 at TP1 allows 2/3 to ride to higher targets
✅ Stops protect capital: Clear invalidation below EMA meant defined risk
✅ Patience is profit: Multi-week hold required but 3R potential justified the wait
✅ Let winners run: TP1 is just the first milestone, not the exit point
📌 Current Trade Summary:
Entry: ~1.7500 (weekly 50 EMA) ✅
TP1: Achieved ✅ (70% position closed)
TP2: ~1.7900 (pending)
Stop: Moved to breakeven (1.7500)
Risk: None (TP1 profit locked, stop at entry)
Remaining Upside: 2R+ to final targets
Status: Trade is working exactly as the weekly structure suggested. First target achieved validates the entry thesis. Remaining position has zero risk with 2R+ upside still available.
🏆 Professional Execution Checklist:
✅ Identified weekly structure (50 EMA support)
✅ Entered at optimal risk point (dynamic support)
✅ Held through consolidation (patience during position development)
✅ Took profits at TP1 (scaled 1/3 off)
✅ Moved stop to breakeven (eliminated remaining risk)
✅ Holding for TP2/TP3 (letting winners run)
This is textbook position management: structure-based entry, defined risk, systematic scaling, and allowing the weekly timeframe thesis to fully develop.
⚠️ What Could Still Go Wrong:
Reversal at Resistance:
TP2 or TP3 zones could reject price strongly. This is why we scale - TP1 profit is already locked regardless of what happens next.
Weekly Close Below 50 EMA:
If price reverses hard and closes back below 1.7500 on a weekly basis, the trend assumption is invalidated. With stop at breakeven, this results in flat or small profit (TP1 gain minus any slippage on remaining 2/3).
Fundamental Shifts:
Euro weakness or AUD strength from unexpected fundamental developments could override technical structure.
Extended Consolidation:
Price could sideways-trade for weeks before attempting TP2/TP3, testing patience even with secured TP1 profit.
⚠️ Important Disclaimers:
This is an educational update on a weekly timeframe trade setup. It is not financial advice or a recommendation to buy or sell EUR/AUD or any currency pair.
The trade has achieved TP1 but there is no guarantee TP2 or TP3 will be reached. The remaining position could reverse, consolidate indefinitely, or fail to reach higher targets.
Weekly timeframe trading requires significant patience and tolerance for drawbacks between targets. Past performance (TP1 achievement) does not guarantee continuation to TP2 or TP3.
Position sizing, risk management, and individual trade planning are essential. This update reflects one trader's approach and may not be suitable for all risk tolerances or timeframes.
All forex trading involves substantial risk of loss. Always conduct independent analysis and manage positions according to your own risk parameters.
✨ Community Check-In:
Did you catch the weekly 50 EMA bounce? Are you scaling out at targets or holding full position? How do you manage weekly timeframe trades through consolidation periods? Share your approach in the comments.
📜 Trust the structure. Scale the targets. Manage the risk.

⭐ Follow the 3-Gate System - tradedesk.rbtrading.site
⭐ Prop Firm Deals - linktr.ee/rb_tradingltd
⭐ #1 Free Trading Journal Lite | +20% Off Pro code RBT20 - rbtrading.site/?ref=RBT20
⭐ Prop Firm Deals - linktr.ee/rb_tradingltd
⭐ #1 Free Trading Journal Lite | +20% Off Pro code RBT20 - rbtrading.site/?ref=RBT20
إخلاء المسؤولية
لا يُقصد بالمعلومات والمنشورات أن تكون، أو تشكل، أي نصيحة مالية أو استثمارية أو تجارية أو أنواع أخرى من النصائح أو التوصيات المقدمة أو المعتمدة من TradingView. اقرأ المزيد في شروط الاستخدام.
⭐ Follow the 3-Gate System - tradedesk.rbtrading.site
⭐ Prop Firm Deals - linktr.ee/rb_tradingltd
⭐ #1 Free Trading Journal Lite | +20% Off Pro code RBT20 - rbtrading.site/?ref=RBT20
⭐ Prop Firm Deals - linktr.ee/rb_tradingltd
⭐ #1 Free Trading Journal Lite | +20% Off Pro code RBT20 - rbtrading.site/?ref=RBT20
إخلاء المسؤولية
لا يُقصد بالمعلومات والمنشورات أن تكون، أو تشكل، أي نصيحة مالية أو استثمارية أو تجارية أو أنواع أخرى من النصائح أو التوصيات المقدمة أو المعتمدة من TradingView. اقرأ المزيد في شروط الاستخدام.