

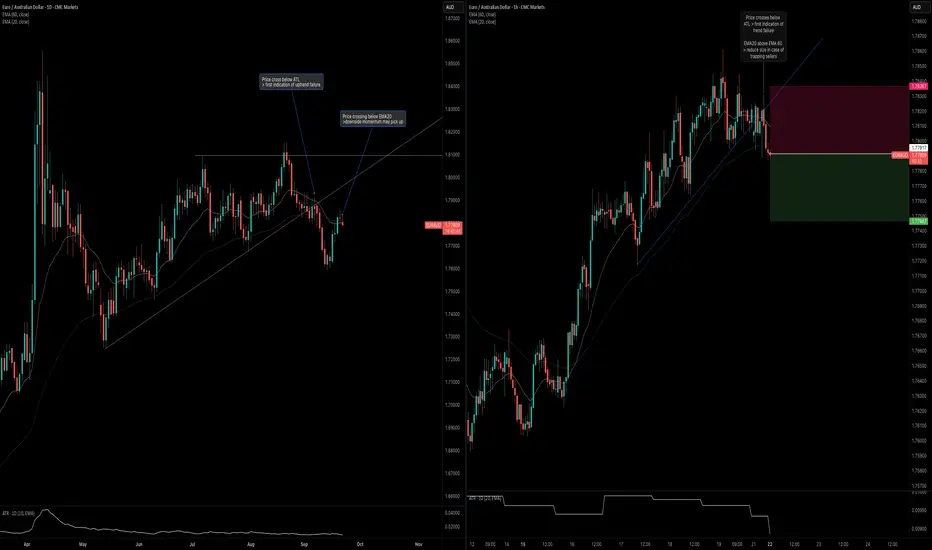
Not my conventional signal as this one is looking to trade in the opposite of the trend.
Daily Timeframe:
H1 Timeframe:
Daily Timeframe:
- EMA20 is barely below EMA60 > downside momentum might pick up
- Price is barely crossing below EMA20 > another indication of downside momentum
- Price crossed below ATL, pulled back, and now seems to be continuing lower
H1 Timeframe:
- Price crosses below ATL > first indication of uptrend failing to continue
- Note that EMA20 is above EMA60 still > there is a risk that this will trap sellers

إخلاء المسؤولية
لا يُقصد بالمعلومات والمنشورات أن تكون، أو تشكل، أي نصيحة مالية أو استثمارية أو تجارية أو أنواع أخرى من النصائح أو التوصيات المقدمة أو المعتمدة من TradingView. اقرأ المزيد في شروط الاستخدام.
إخلاء المسؤولية
لا يُقصد بالمعلومات والمنشورات أن تكون، أو تشكل، أي نصيحة مالية أو استثمارية أو تجارية أو أنواع أخرى من النصائح أو التوصيات المقدمة أو المعتمدة من TradingView. اقرأ المزيد في شروط الاستخدام.