

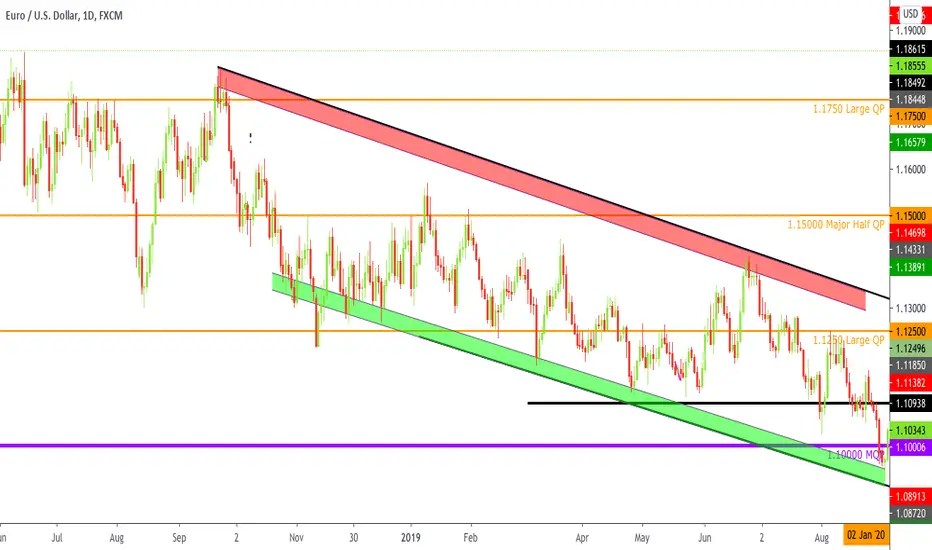
The above chart shows what is called a “channel” in trading. It is basically diagonal support and resistance (a.k.a Trend-lines). The area in between is known as a channel.
The red zone is said to be the perfect entry area for sells whereas the green is for buys.
How To Find The Zones?
Using the “Parallel Lines” tool, draw the diagonal S/R then measure the first candle/wick that starts the channel and that area is where you would get entries with the least possible drawdown.
The red zone is said to be the perfect entry area for sells whereas the green is for buys.
How To Find The Zones?
Using the “Parallel Lines” tool, draw the diagonal S/R then measure the first candle/wick that starts the channel and that area is where you would get entries with the least possible drawdown.

إخلاء المسؤولية
لا يُقصد بالمعلومات والمنشورات أن تكون، أو تشكل، أي نصيحة مالية أو استثمارية أو تجارية أو أنواع أخرى من النصائح أو التوصيات المقدمة أو المعتمدة من TradingView. اقرأ المزيد في شروط الاستخدام.
إخلاء المسؤولية
لا يُقصد بالمعلومات والمنشورات أن تكون، أو تشكل، أي نصيحة مالية أو استثمارية أو تجارية أو أنواع أخرى من النصائح أو التوصيات المقدمة أو المعتمدة من TradingView. اقرأ المزيد في شروط الاستخدام.