

EURUSD 4H: SBR Zone Breakdown & Downward Channel and CHoCH
Key Technical Elements
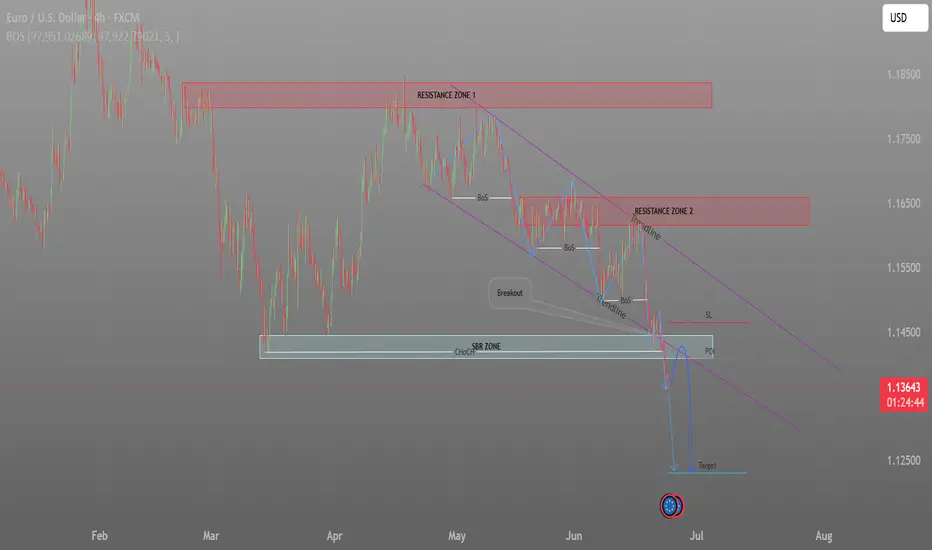
Descending Channels & Trendlines: Two parallel, downward-sloping purple trendlines form a clear descending channel. Price has consistently respected the upper trendline as resistance, creating lower highs.
Support and Resistance Zones:
Resistance Zone 1: A major horizontal red block near the top ($1.1800 - $1.1850).
Resistance Zone 2: A secondary horizontal red block acting as a lower structural ceiling ($1.1600 - $1.1650).
SBR Zone (Support Becomes Resistance) / CHoCH: A gray horizontal band situated around the $1.1400 - $1.1450 area. This level previously acted as strong support during March and April but has recently experienced a "Breakout" to the downside.
Market Structure Indicators: The chart features labeled structural shifts, including multiple instances of BoS (Break of Structure) pointing to continued bearish momentum, and a CHoCH (Change of Character) near the recent breakdown level.
Projected Trade Setup
The chart outlines a classic bearish retest-and-continuation strategy indicated by the drawn blue paths:
The Breakout: Price recently accelerated sharply below the SBR Zone support.
Point of Interest (POI) & Retest: The blue arrow projects a short-term corrective rally back up to the POI (around $1.1425), retesting the newly broken SBR zone from underneath.
Risk Management Levels:
SL (Stop Loss): Marked by a horizontal red line just above the POI, roughly at $1.1460, invalidating the short idea if the price re-enters the old range.
Target (Take Profit): Marked by a horizontal teal line near the $1.1200 - $1.1225 macro liquidity level, representing the expected extension of the downward move.
Descending Channels & Trendlines: Two parallel, downward-sloping purple trendlines form a clear descending channel. Price has consistently respected the upper trendline as resistance, creating lower highs.
Support and Resistance Zones:
Resistance Zone 1: A major horizontal red block near the top ($1.1800 - $1.1850).
Resistance Zone 2: A secondary horizontal red block acting as a lower structural ceiling ($1.1600 - $1.1650).
SBR Zone (Support Becomes Resistance) / CHoCH: A gray horizontal band situated around the $1.1400 - $1.1450 area. This level previously acted as strong support during March and April but has recently experienced a "Breakout" to the downside.
Market Structure Indicators: The chart features labeled structural shifts, including multiple instances of BoS (Break of Structure) pointing to continued bearish momentum, and a CHoCH (Change of Character) near the recent breakdown level.
Projected Trade Setup
The chart outlines a classic bearish retest-and-continuation strategy indicated by the drawn blue paths:
The Breakout: Price recently accelerated sharply below the SBR Zone support.
Point of Interest (POI) & Retest: The blue arrow projects a short-term corrective rally back up to the POI (around $1.1425), retesting the newly broken SBR zone from underneath.
Risk Management Levels:
SL (Stop Loss): Marked by a horizontal red line just above the POI, roughly at $1.1460, invalidating the short idea if the price re-enters the old range.
Target (Take Profit): Marked by a horizontal teal line near the $1.1200 - $1.1225 macro liquidity level, representing the expected extension of the downward move.
تم فتح الصفقة

Free Forex signals & Daily updates 💹
t.me/+D1falYavqJAxMzE0
For any assistance contact us 🤓
t.me/Travis_816
Join Us Today On Telegram 👆👆
t.me/+D1falYavqJAxMzE0
For any assistance contact us 🤓
t.me/Travis_816
Join Us Today On Telegram 👆👆
منشورات ذات صلة
إخلاء المسؤولية
لا يُقصد بالمعلومات والمنشورات أن تكون، أو تشكل، أي نصيحة مالية أو استثمارية أو تجارية أو أنواع أخرى من النصائح أو التوصيات المقدمة أو المعتمدة من TradingView. اقرأ المزيد في شروط الاستخدام.
Free Forex signals & Daily updates 💹
t.me/+D1falYavqJAxMzE0
For any assistance contact us 🤓
t.me/Travis_816
Join Us Today On Telegram 👆👆
t.me/+D1falYavqJAxMzE0
For any assistance contact us 🤓
t.me/Travis_816
Join Us Today On Telegram 👆👆
منشورات ذات صلة
إخلاء المسؤولية
لا يُقصد بالمعلومات والمنشورات أن تكون، أو تشكل، أي نصيحة مالية أو استثمارية أو تجارية أو أنواع أخرى من النصائح أو التوصيات المقدمة أو المعتمدة من TradingView. اقرأ المزيد في شروط الاستخدام.