
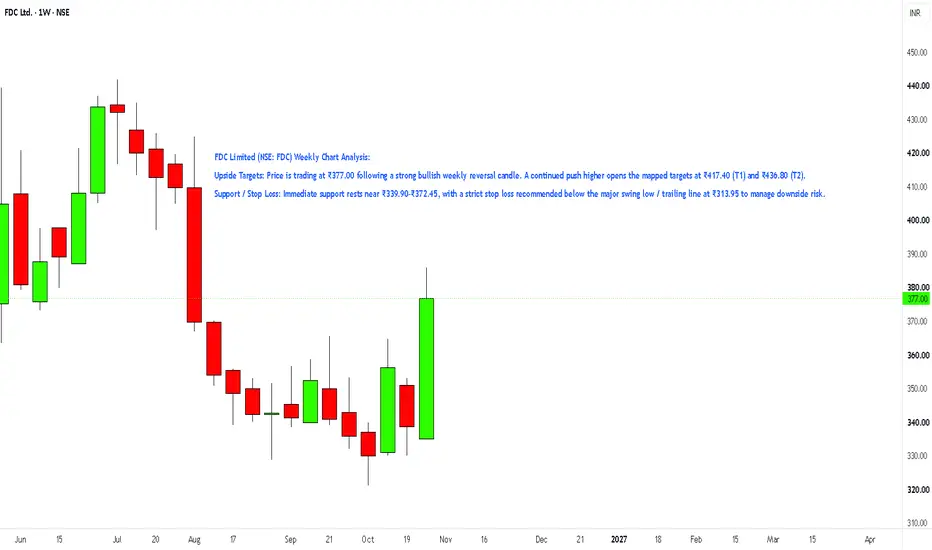
FDC Limited (NSE: FDC) Weekly Chart Analysis:
Upside Targets: Price is trading at ₹377.00 following a strong bullish weekly reversal candle. A continued push higher opens the mapped targets at ₹417.40 (T1) and ₹436.80 (T2).
Support / Stop Loss: Immediate support rests near ₹339.90–₹372.45, with a strict stop loss recommended below the major swing low / trailing line at ₹313.95 to manage downside risk.
Upside Targets: Price is trading at ₹377.00 following a strong bullish weekly reversal candle. A continued push higher opens the mapped targets at ₹417.40 (T1) and ₹436.80 (T2).
Support / Stop Loss: Immediate support rests near ₹339.90–₹372.45, with a strict stop loss recommended below the major swing low / trailing line at ₹313.95 to manage downside risk.

Automated Tools/Indicators/Screeners available at kkonline.org/nimblrta
إخلاء المسؤولية
لا يُقصد بالمعلومات والمنشورات أن تكون، أو تشكل، أي نصيحة مالية أو استثمارية أو تجارية أو أنواع أخرى من النصائح أو التوصيات المقدمة أو المعتمدة من TradingView. اقرأ المزيد في شروط الاستخدام.
Automated Tools/Indicators/Screeners available at kkonline.org/nimblrta
إخلاء المسؤولية
لا يُقصد بالمعلومات والمنشورات أن تكون، أو تشكل، أي نصيحة مالية أو استثمارية أو تجارية أو أنواع أخرى من النصائح أو التوصيات المقدمة أو المعتمدة من TradingView. اقرأ المزيد في شروط الاستخدام.