
FET/USDT – Chart Update
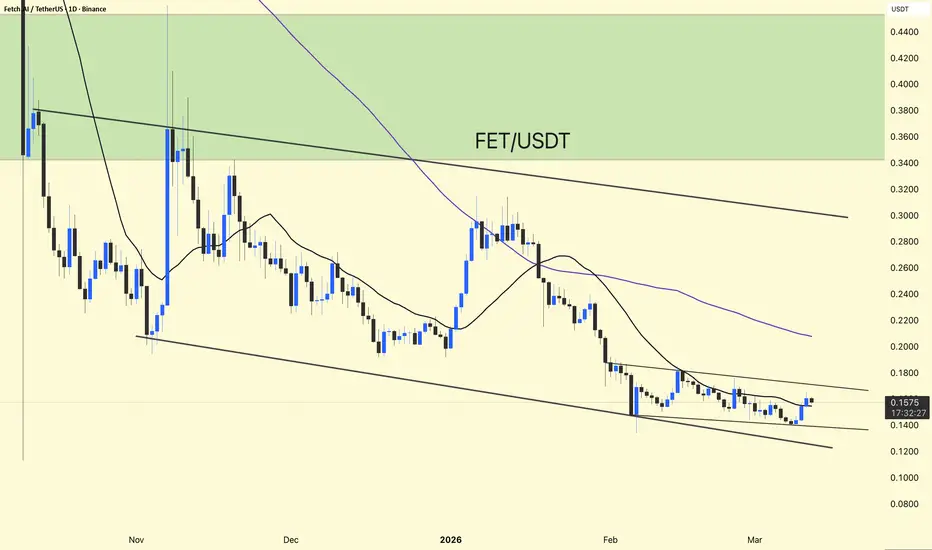
FET is currently trading around $0.157, moving inside a descending channel structure.
Price is holding near the lower channel support, where buyers are starting to step in.
The recent bounce suggests short-term recovery, but the trend is still bearish until resistance breaks.
The upper channel trendline near $0.17–$0.18 is acting as immediate resistance.
Bullish Scenario:
If FET breaks above $0.18, the next potential targets could be:
$0.22
$0.26
Bearish Scenario:
If the price loses the $0.14 support, the downside may extend toward:
$0.12
$0.10 support zone
FET is attempting a short-term bounce from channel support, but a break above $0.18 is needed to confirm stronger bullish momentum.
DYOR | NFA
FET is currently trading around $0.157, moving inside a descending channel structure.
Price is holding near the lower channel support, where buyers are starting to step in.
The recent bounce suggests short-term recovery, but the trend is still bearish until resistance breaks.
The upper channel trendline near $0.17–$0.18 is acting as immediate resistance.
Bullish Scenario:
If FET breaks above $0.18, the next potential targets could be:
$0.22
$0.26
Bearish Scenario:
If the price loses the $0.14 support, the downside may extend toward:
$0.12
$0.10 support zone
FET is attempting a short-term bounce from channel support, but a break above $0.18 is needed to confirm stronger bullish momentum.
DYOR | NFA

منشورات ذات صلة
إخلاء المسؤولية
لا يُقصد بالمعلومات والمنشورات أن تكون، أو تشكل، أي نصيحة مالية أو استثمارية أو تجارية أو أنواع أخرى من النصائح أو التوصيات المقدمة أو المعتمدة من TradingView. اقرأ المزيد في شروط الاستخدام.
منشورات ذات صلة
إخلاء المسؤولية
لا يُقصد بالمعلومات والمنشورات أن تكون، أو تشكل، أي نصيحة مالية أو استثمارية أو تجارية أو أنواع أخرى من النصائح أو التوصيات المقدمة أو المعتمدة من TradingView. اقرأ المزيد في شروط الاستخدام.