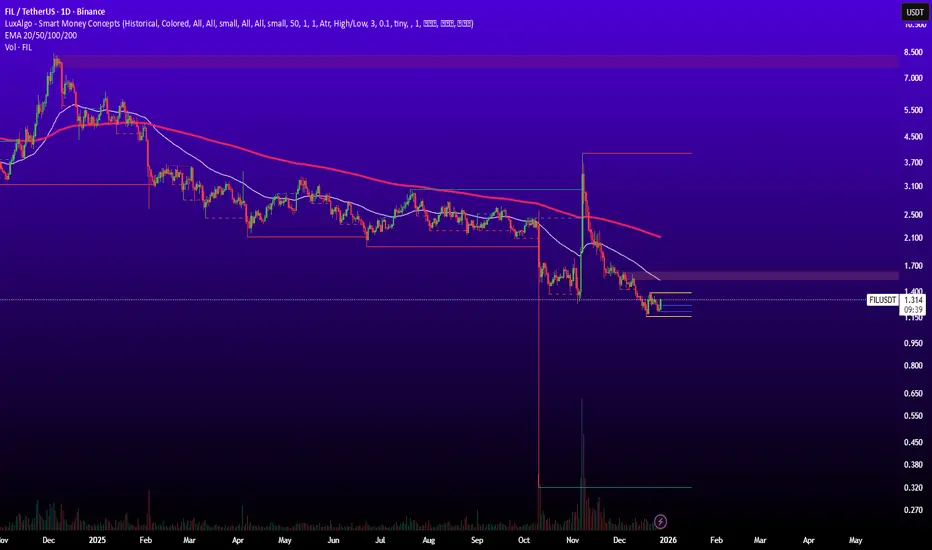
The daily chart of 
 FILUSDT shows an overall bearish structure, but weakening selling pressure and price consolidation suggest that downside momentum is fading at current levels.
Price is moving inside a lower-range trading zone, and a breakout above the range high could be the first sign of a bearish trend correction.
FILUSDT shows an overall bearish structure, but weakening selling pressure and price consolidation suggest that downside momentum is fading at current levels.Price is moving inside a lower-range trading zone, and a breakout above the range high could be the first sign of a bearish trend correction.
- Supports:
- 1.150
- Resistances:
- 1.311
- 1.600 to 1.700
- 2.100
- 2.500

منشورات ذات صلة
إخلاء المسؤولية
لا يُقصد بالمعلومات والمنشورات أن تكون، أو تشكل، أي نصيحة مالية أو استثمارية أو تجارية أو أنواع أخرى من النصائح أو التوصيات المقدمة أو المعتمدة من TradingView. اقرأ المزيد في شروط الاستخدام.
إخلاء المسؤولية
لا يُقصد بالمعلومات والمنشورات أن تكون، أو تشكل، أي نصيحة مالية أو استثمارية أو تجارية أو أنواع أخرى من النصائح أو التوصيات المقدمة أو المعتمدة من TradingView. اقرأ المزيد في شروط الاستخدام.