

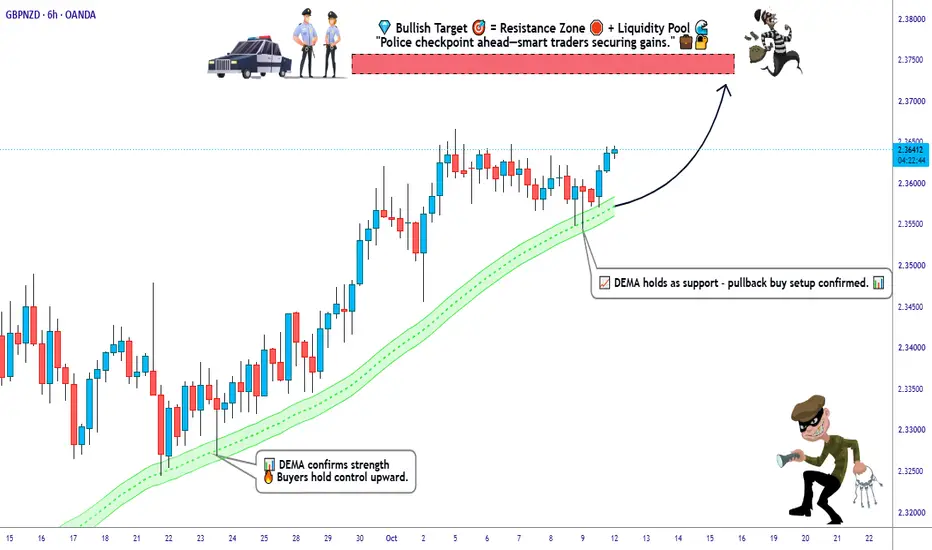
GBP/NZD👑
POUND STERLING VS KIWI — FOREX BANK Wealth Strategy Map 🏦
📊 MY ANALYSIS
Alright, Thief OG's, let's dissect this GBP/NZD battlefield with surgical precision. The Pound Sterling vs Kiwi cross is currently painting a compelling technical picture on the Day/Swing timeframe, and my analysis suggests the bulls are still holding the steering wheel despite some interesting fundamental crosswinds brewing beneath the surface.
Price action has been respecting higher lows since the September consolidation phase, and we're now approaching a critical liquidity zone that smart money has been eyeing. The pair recently cleared the July peak around 2.3544, which was a major structural resistance that capped rallies for months . That breakout, even if it hasn't seen a decisive daily close above it yet, tells me the market's underlying bias remains tilted to the upside.
📈 MY MARKET BIAS
Bullish. Let me be crystal clear here — my market bias leans bullish on GBP/NZD for the Day/Swing trade horizon, but with a tactical caution flag raised. We're trading near multi-year highs , and while the structure supports continuation, the RSI is hovering around 70, which historically flags overbought conditions and elevated pullback risk . This isn't a chase zone; it's a plan zone.
Sterling has been the beneficiary of a UK economy that's "defied the gloom," with Q2 growth revised higher to 0.5% . Meanwhile, the Kiwi has been the worst-performing G10 currency, with NZD/USD losing over 4% in September despite an 80% probability of an RBNZ rate hike being priced in . That's a market telling you something: rate hike expectations alone aren't enough to save a currency when global risk dynamics and US yield differentials are working against it.
🎯 POSSIBLE SCENARIO
Here's how I'm mapping the tape. Price is approaching a supply zone I've identified between 2.35800 – 2.36500, which is where I want to engage with a layering entry approach using sell limit orders. This is NOT a blind fade — this is a calculated activation of my Wealth Strategy Map at a zone where price action, momentum, and structural confluence align.
The narrative I'm watching: If price pushes into this zone and shows rejection signals (wick-heavy candles, bearish engulfing patterns, or RSI divergence on lower timeframes), we have a high-probability setup for a rotation back toward the downside liquidity pool. The police force acts as a strong resistance here — meaning this isn't just a technical level; it's a psychological and order-flow battleground where the trap for late longs could spring.
👀 AREAS I AM WATCHING
Key Resistance Zone: 2.35800 – 2.36500 (my layering entry kill zone)
Critical Support Levels:
2.35300 — This is the Thief SL. A sustained break below this invalidates my immediate bullish rotation thesis and tells me the bears have seized short-term control.
2.3468 — H1 50-period moving average, a dynamic support that held the late September dip .
2.3384 — H1 200-period moving average, deeper structural support .
Main / Final Target: 2.37500 🎯
The 2.37500 level represents my primary objective on this rotation. This is where I expect the confluence of resistance, overbought conditions, trap dynamics, and potential reversal pressure to materialize. Kindly escape with profits at or near this zone — don't be the trader who gets greedy and watches gains evaporate because they wanted "just a little more."
⚠️ TRADE MANAGEMENT NOTE
Dear Ladies & Gentlemen (Thief OG's) — I am NOT recommending you set only my TP or only my SL. This is my map. Your execution is YOUR choice. You can make money and take money at your own risk. The levels above are reference points from my analysis, not financial advice. 🫡
📚 EDUCATIONAL BREAKDOWN
Let me break down the "why" behind the levels, because understanding the mechanics matters more than copying entries.
Why 2.35800 – 2.36500 for layering entries?
This zone sits just above the July 2026 peak at 2.3544, which was a multi-month ceiling . When price breaks above a major resistance, that level often flips into support on a retest. But here's the nuance: we haven't seen a decisive daily close above it, meaning the breakout isn't fully confirmed . This ambiguity creates a window where sellers can attempt to defend higher levels, especially when momentum indicators are stretched.
Why the RSI matters here:
RSI at 70 on the daily is a statistical warning sign. It doesn't mean "sell immediately" — strong trends can stay overbought for extended periods. But combined with price approaching a fresh supply zone and the lack of a confirmed daily close above the breakout level, it tilts the tactical odds toward a mean-reversion move before any further sustained upside.
The "trap" dynamic:
Late breakout traders often chase price above 2.3544 without waiting for confirmation. If price pushes into 2.35800 – 2.36500 and then reverses, those late longs get trapped, and their stop-losses become fuel for the downside rotation toward my target. This is why the zone is described as where "police force acts as strong resistance + trap."
Why 2.37500 as the main target?
This level aligns with my projected extension of the rotation if the downside pressure materializes as anticipated. It's not a random number — it represents a zone where prior structure and liquidity dynamics converge.
🔗 RELATED PAIRS TO WATCH
Understanding correlations is critical for context. Here's what I'm monitoring:
GBPAUD
— Positive correlation with GBP/NZD. The Pound tends to move in tandem against both antipodean currencies. If GBP/AUD is also approaching resistance, it reinforces the case for Sterling weakness across the board rather than NZD-specific strength .
AUDNZD
— The "Kiwi Cross." This pair is a pure read on NZD strength vs its closest cousin. If AUD/NZD is rising, it suggests NZD weakness is the dominant driver in GBP/NZD, which would support the bullish GBP/NZD thesis .
NZDUSD
— The Kiwi's relationship with the US Dollar is critical. NZD/USD has been highly sensitive to US Treasury yields, and the pair's weakness has persisted even with RBNZ hike expectations elevated . If NZD/USD remains heavy, it caps GBP/NZD downside potential.
GBPUSD
— Cable's direction matters for GBP/NZD. Sterling strength against the Dollar, driven by UK economic resilience and BoE hold dynamics , supports the bullish GBP/NZD structure.
🌍 LIVE MARKET UPDATE — FUNDAMENTAL & ECONOMIC DRIVERS
UK Side (GBP):
The Bank of England held Bank Rate at 3.75% in September, with inflation at 3.1% and upside risks flagged due to Middle East energy price volatility . The MPC's language suggests a cautious hold rather than an imminent cut — Deputy Governor Ramsden noted that holding rates is an "active response" to inflation risks . UK Q2 GDP was revised higher to 0.5% from 0.4%, reinforcing the "resilient economy" narrative . However, MPC member Megan Greene warned that relying on high bond yields to do the tightening work is "dangerous" , hinting at internal pressure for a more hawkish stance. The UK Autumn Budget is scheduled for October 28 and will be a volatility catalyst .
New Zealand Side (NZD):
The RBNZ raised the OCR to 2.75% in September but signaled a potential pause, which markets interpreted as dovish relative to expectations . October rate hike probability has since fallen to around 58% from 80% in late September . The Kiwi's trade-weighted index has hit a 15-year low, adding to imported inflation pressure . Business confidence is near a 12-year high, but activity remains flat, leaving economists split on whether the RBNZ should hike again on October 28 . ANZ, BNZ, and ASB expect a hike; Westpac and Kiwibank argue for a pause . Governor Breman has said there is no pre-set path, making her upcoming comments particularly high-impact .
US Side (Global Risk Backdrop):
The Fed raised rates to 3.75-4% and signaled one more hike possible this year . US 10-year yields traded as high as 5.30%, pressuring high-beta currencies like NZD . US economic data has surprised to the upside, with strong payrolls and retail sales . This environment of higher US yields and global monetary tightening is a headwind for risk-sensitive currencies like the Kiwi.
Key Upcoming Events to Watch:
RBNZ Governor Breman speech (this week) — guidance on October 28 decision
UK Autumn Budget — October 28
RBNZ OCR decision — October 28
Fed FOMC minutes and US jobless claims
💬 THIEF TRADER STYLE WISHES & MOTIVATION
"Steal the pips, not the risk. The market rewards patience, punishes greed, and respects those who respect their stop-loss."
"Every trap is a gift if you're on the right side of it. Don't be the liquidity — take the liquidity." 💰
"Plan the trade. Trade the plan. The Thief OG's don't chase candles; they set traps and wait." 🎯
"The best thieves are invisible. The best trades are boring. Excitement is expensive." 🧠
"Risk management isn't a suggestion — it's the difference between a thief and a victim." ⚔️
🎯 SUMMARY — THE WEALTH STRATEGY MAP
Bias: Bullish structural, tactical caution at resistance
Entry Zone: 2.35800 – 2.36500 (layering sell limits)
SL: 2.35300 (Thief SL — your choice, your risk)
Main Target: 2.37500 (escape with profits)
Key Driver: Kiwi weakness vs resilient Sterling, with tactical pullback risk from overbought RSI
Related Pairs:
GBP/AUD,AUD/NZD,
NZD/USD,GBP/USD
Trade smart, Thief OG's. The market doesn't owe anyone a living — but it does reward those who prepare. 🏆

إخلاء المسؤولية
لا يُقصد بالمعلومات والمنشورات أن تكون، أو تشكل، أي نصيحة مالية أو استثمارية أو تجارية أو أنواع أخرى من النصائح أو التوصيات المقدمة أو المعتمدة من TradingView. اقرأ المزيد في شروط الاستخدام.
إخلاء المسؤولية
لا يُقصد بالمعلومات والمنشورات أن تكون، أو تشكل، أي نصيحة مالية أو استثمارية أو تجارية أو أنواع أخرى من النصائح أو التوصيات المقدمة أو المعتمدة من TradingView. اقرأ المزيد في شروط الاستخدام.