
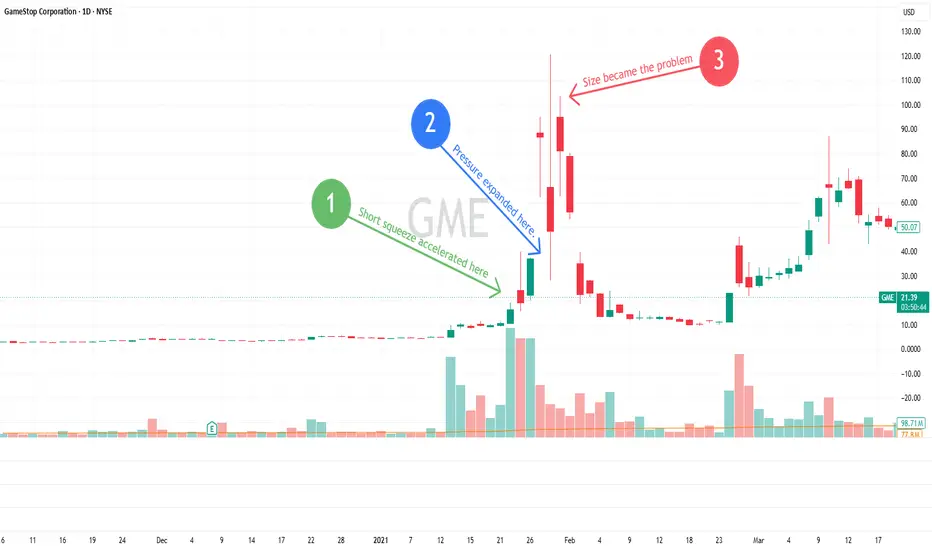
The chart did not expose a bad idea. It exposed bad size.
That matters.
A trader can be wrong and still survive. A trader can even be very wrong and recover if risk
is contained. But once size gets large enough, the trade stops being a decision problem
and becomes a pressure problem.
That is what this GME chart shows.
Look at the sequence. The squeeze starts accelerating. Then volatility expands. Then the
move becomes violent enough that size takes control of the outcome. At that point, the
position is no longer being managed by structure. It is being managed by pain.
That is where trades stop behaving like trades.
They start behaving like events.
This is the part many traders miss. The first mistake is often blamed on bias, analysis, or
conviction. The larger mistake is exposure. A position can be wrong for days. Size is what
turns being wrong into being trapped.
The chart shows exactly where that shift happened. The move stopped being a normal
adverse move and became a disorderly expansion. Anyone leaning too hard against it was
no longer dealing with a chart pattern.
They were dealing with pressure.
Pressure changes behavior fast. It distorts judgment. It makes traders defend risk they
should reduce. It makes them wait longer than planned. It makes them search for reasons
to stay in a trade that is already out of control.
That decision has a cost whether it is realized in one day or spread across several.
In January 2021, Melvin Capital lost 53% during the GameStop short squeeze. The lesson
was not only that the position was wrong. The lesson was that the exposure was too large
for the event. Once the squeeze accelerated, size made clean decision-making harder and
clean risk control less available.
That is the institutional version of the same mistake traders make on a smaller scale.
In my own options trading my sizing formula is: account balance multiplied by risk
percentage divided by 2ATR. That number equals the number of shares to purchase. Since
I trade options, I take the number of shares divided by delta (usually around 80) and that
gives me the number of options contracts to purchase. Example: $100,000.00 x 0.05 / (2 x
1.50) = 1,666 shares. 1,666 / 80 = 20 options contracts.
I use the 10 EMA over the 20 EMA and price over the 50 EMA as part of trend structure,
along with other confirmation tools. Entry is defined. The stop is defined. Risk is defined.
The trade is not random before pressure appears.
That is the point.
When structure is in place, pressure has less room to take control. When size overwhelms
structure, the rule loses authority. The trader may still think he is managing the trade.
He is not.
He is managing discomfort.
This is not a knowledge problem. It is an execution problem. The chart already told the
story. The squeeze accelerated. Pressure expanded. Size became the problem.
If the size can override the plan, then the size was wrong before the trade ever moved.
A plan only matters if it still controls the trade when pressure stops feeling theoretical.
That matters.
A trader can be wrong and still survive. A trader can even be very wrong and recover if risk
is contained. But once size gets large enough, the trade stops being a decision problem
and becomes a pressure problem.
That is what this GME chart shows.
Look at the sequence. The squeeze starts accelerating. Then volatility expands. Then the
move becomes violent enough that size takes control of the outcome. At that point, the
position is no longer being managed by structure. It is being managed by pain.
That is where trades stop behaving like trades.
They start behaving like events.
This is the part many traders miss. The first mistake is often blamed on bias, analysis, or
conviction. The larger mistake is exposure. A position can be wrong for days. Size is what
turns being wrong into being trapped.
The chart shows exactly where that shift happened. The move stopped being a normal
adverse move and became a disorderly expansion. Anyone leaning too hard against it was
no longer dealing with a chart pattern.
They were dealing with pressure.
Pressure changes behavior fast. It distorts judgment. It makes traders defend risk they
should reduce. It makes them wait longer than planned. It makes them search for reasons
to stay in a trade that is already out of control.
That decision has a cost whether it is realized in one day or spread across several.
In January 2021, Melvin Capital lost 53% during the GameStop short squeeze. The lesson
was not only that the position was wrong. The lesson was that the exposure was too large
for the event. Once the squeeze accelerated, size made clean decision-making harder and
clean risk control less available.
That is the institutional version of the same mistake traders make on a smaller scale.
In my own options trading my sizing formula is: account balance multiplied by risk
percentage divided by 2ATR. That number equals the number of shares to purchase. Since
I trade options, I take the number of shares divided by delta (usually around 80) and that
gives me the number of options contracts to purchase. Example: $100,000.00 x 0.05 / (2 x
1.50) = 1,666 shares. 1,666 / 80 = 20 options contracts.
I use the 10 EMA over the 20 EMA and price over the 50 EMA as part of trend structure,
along with other confirmation tools. Entry is defined. The stop is defined. Risk is defined.
The trade is not random before pressure appears.
That is the point.
When structure is in place, pressure has less room to take control. When size overwhelms
structure, the rule loses authority. The trader may still think he is managing the trade.
He is not.
He is managing discomfort.
This is not a knowledge problem. It is an execution problem. The chart already told the
story. The squeeze accelerated. Pressure expanded. Size became the problem.
If the size can override the plan, then the size was wrong before the trade ever moved.
A plan only matters if it still controls the trade when pressure stops feeling theoretical.

إخلاء المسؤولية
لا يُقصد بالمعلومات والمنشورات أن تكون، أو تشكل، أي نصيحة مالية أو استثمارية أو تجارية أو أنواع أخرى من النصائح أو التوصيات المقدمة أو المعتمدة من TradingView. اقرأ المزيد في شروط الاستخدام.
إخلاء المسؤولية
لا يُقصد بالمعلومات والمنشورات أن تكون، أو تشكل، أي نصيحة مالية أو استثمارية أو تجارية أو أنواع أخرى من النصائح أو التوصيات المقدمة أو المعتمدة من TradingView. اقرأ المزيد في شروط الاستخدام.