
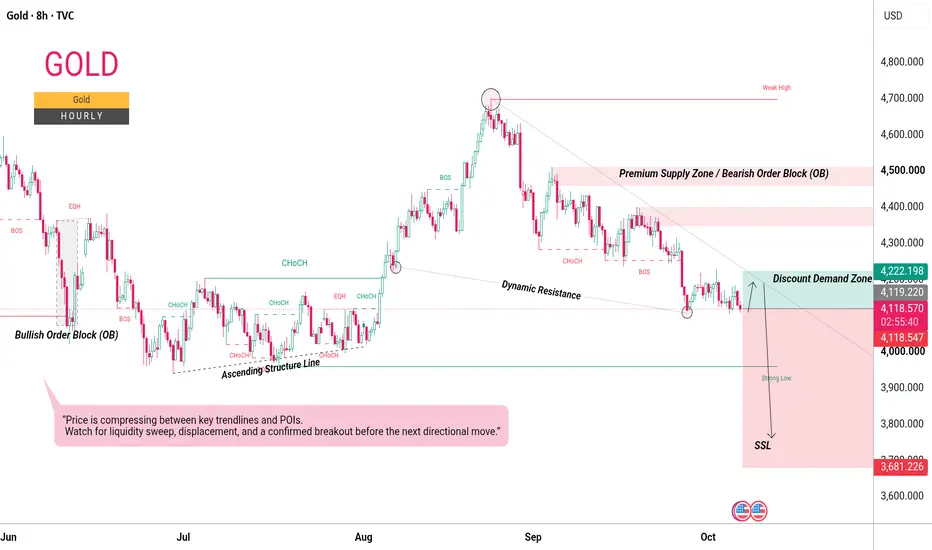
This chart highlights the key market structure, trendlines, and significant price levels that may influence the next market move. The descending trendline represents dynamic resistance, while the ascending trendline acts as a potential support level. Key areas such as the 4,500 Premium Supply Zone and the 4,197 Demand Zone are important points of interest where price may react. Below the current structure, 3,758 represents a potential Sell-Side Liquidity (SSL) target. Traders should monitor these zones for liquidity sweeps, strong displacement, and a confirmed break of structure (BOS) or change of character (CHoCH). A decisive breakout or rejection from these levels could help establish the next directional bias. Until confirmation appears, patience and proper risk management remain essential.
تم فتح الصفقة
Market is following the predicted path, and further continuation remains possible. Hold and wait for the next move. Stay patient and let the setup play out according to the planned structure.أغلقت الصفقة: تم الوصول للهدف

منشورات ذات صلة
إخلاء المسؤولية
لا يُقصد بالمعلومات والمنشورات أن تكون، أو تشكل، أي نصيحة مالية أو استثمارية أو تجارية أو أنواع أخرى من النصائح أو التوصيات المقدمة أو المعتمدة من TradingView. اقرأ المزيد في شروط الاستخدام.
منشورات ذات صلة
إخلاء المسؤولية
لا يُقصد بالمعلومات والمنشورات أن تكون، أو تشكل، أي نصيحة مالية أو استثمارية أو تجارية أو أنواع أخرى من النصائح أو التوصيات المقدمة أو المعتمدة من TradingView. اقرأ المزيد في شروط الاستخدام.