
Gold Below $4,140: Bounce Before Wave C?
Gold remains under pressure near $4,121. But what if the next rebound is merely another corrective move before the market resumes its decline?
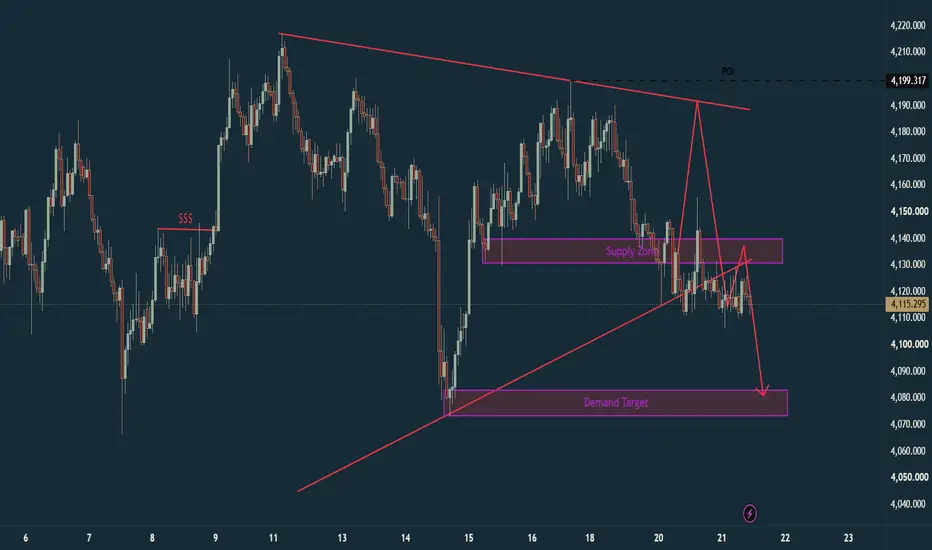
The latest structure suggests that sellers are maintaining control beneath the descending resistance trendline, while the $4,130–$4,140 area represents an important recovery test.
Elliott Wave — Is Wave C Developing?
The decline from approximately $4,217 to $4,073 may represent Wave A of a broader bearish correction.
Gold subsequently recovered toward $4,199, potentially forming Wave B without breaking the descending resistance structure.
The latest downward movement could therefore be an evolving Wave C.
This interpretation remains provisional until the internal wave sequence provides stronger confirmation.
Fibonacci — Watch the Retracement
Using the recent decline from approximately $4,199 to $4,108, the key retracement references are:
23.6% — $4,130: Initial recovery resistance.
38.2% — $4,143: Secondary resistance.
50% — $4,154: Deeper corrective recovery.
61.8% — $4,164: Important alternative rebound reference.
The 23.6% retracement aligns closely with the marked $4,130–$4,140 resistance zone.
Primary Scenario — Bearish Continuation
If Gold rebounds into $4,130–$4,140 and encounters renewed selling pressure, the potential Wave C decline could resume.
A confirmed breakdown beneath $4,108–$4,110 would strengthen the bearish case and expose the marked $4,073–$4,082 demand target.
Alternative Scenario — A Deeper Rebound
A sustained recovery above $4,140 could open the way toward the 50%–61.8% Fibonacci retracement region at $4,154–$4,164.
A stronger recovery toward the descending trendline near $4,190 remains possible.
A sustained break above $4,199 would require reassessing the current bearish wave interpretation.
The Bigger Picture
Rising oil prices and expectations of tighter Federal Reserve policy continue to weigh on Gold, although geopolitical uncertainty could support temporary recoveries.
Fibonacci identifies the reaction levels. Elliott Wave provides the possible structure. Neither confirms the next move without price action.
The question now is whether Gold needs one more corrective rebound before the next bearish extension.
Would you expect a rejection near $4,140 or a deeper recovery first?
Gold remains under pressure near $4,121. But what if the next rebound is merely another corrective move before the market resumes its decline?
The latest structure suggests that sellers are maintaining control beneath the descending resistance trendline, while the $4,130–$4,140 area represents an important recovery test.
Elliott Wave — Is Wave C Developing?
The decline from approximately $4,217 to $4,073 may represent Wave A of a broader bearish correction.
Gold subsequently recovered toward $4,199, potentially forming Wave B without breaking the descending resistance structure.
The latest downward movement could therefore be an evolving Wave C.
This interpretation remains provisional until the internal wave sequence provides stronger confirmation.
Fibonacci — Watch the Retracement
Using the recent decline from approximately $4,199 to $4,108, the key retracement references are:
23.6% — $4,130: Initial recovery resistance.
38.2% — $4,143: Secondary resistance.
50% — $4,154: Deeper corrective recovery.
61.8% — $4,164: Important alternative rebound reference.
The 23.6% retracement aligns closely with the marked $4,130–$4,140 resistance zone.
Primary Scenario — Bearish Continuation
If Gold rebounds into $4,130–$4,140 and encounters renewed selling pressure, the potential Wave C decline could resume.
A confirmed breakdown beneath $4,108–$4,110 would strengthen the bearish case and expose the marked $4,073–$4,082 demand target.
Alternative Scenario — A Deeper Rebound
A sustained recovery above $4,140 could open the way toward the 50%–61.8% Fibonacci retracement region at $4,154–$4,164.
A stronger recovery toward the descending trendline near $4,190 remains possible.
A sustained break above $4,199 would require reassessing the current bearish wave interpretation.
The Bigger Picture
Rising oil prices and expectations of tighter Federal Reserve policy continue to weigh on Gold, although geopolitical uncertainty could support temporary recoveries.
Fibonacci identifies the reaction levels. Elliott Wave provides the possible structure. Neither confirms the next move without price action.
The question now is whether Gold needs one more corrective rebound before the next bearish extension.
Would you expect a rejection near $4,140 or a deeper recovery first?

منشورات ذات صلة
إخلاء المسؤولية
لا يُقصد بالمعلومات والمنشورات أن تكون، أو تشكل، أي نصيحة مالية أو استثمارية أو تجارية أو أنواع أخرى من النصائح أو التوصيات المقدمة أو المعتمدة من TradingView. اقرأ المزيد في شروط الاستخدام.
منشورات ذات صلة
إخلاء المسؤولية
لا يُقصد بالمعلومات والمنشورات أن تكون، أو تشكل، أي نصيحة مالية أو استثمارية أو تجارية أو أنواع أخرى من النصائح أو التوصيات المقدمة أو المعتمدة من TradingView. اقرأ المزيد في شروط الاستخدام.