
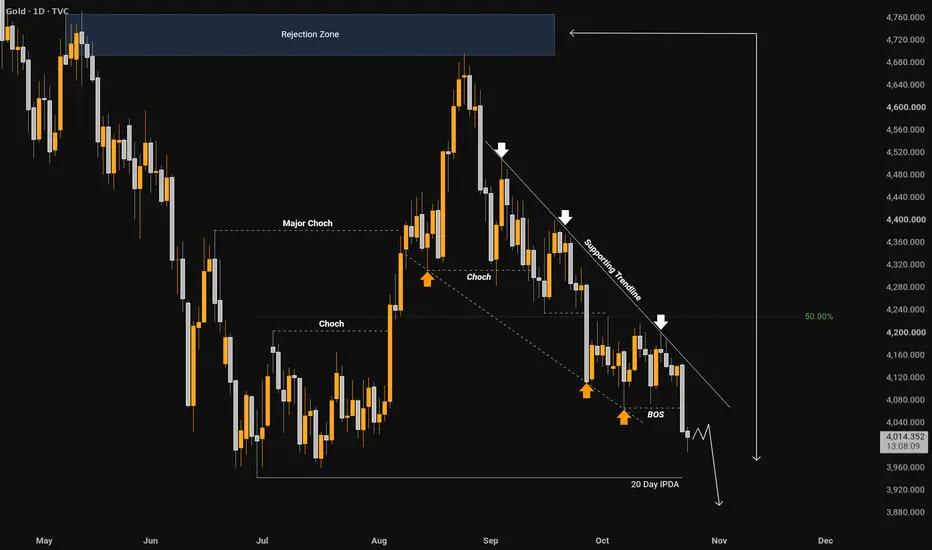
Hello traders! This analysis provides an in-depth breakdown of the Gold (1D Timeframe) market structure using advanced Price Action and Smart Money Concepts (SMC). Let's break down the technical components step-by-step to understand the current market psychology and potential future trajectory:
1. Premium Rejection Zone (Supply/Resistance):
What it is: At the top of the chart, a wide horizontal block is marked as the Rejection Zone. This zone represents a high-timeframe institutional supply area where heavy selling pressure previously entered the market.
Market Behavior: Whenever price retraces back up into this premium zone, institutional sellers aggressively step in to push the price lower. It acts as a critical ceiling that protects the overarching macro downtrend, ensuring that buyers are unable to sustain higher prices.
2. Market Structure Shift (CHoCH - Change of Character):
Major CHoCH: The chart highlights a Major CHoCH early in the sequence. A Change of Character (CHoCH) signifies a critical transition point where market sentiment shifts from bullish to bearish (or vice versa). This particular major shift invalidated the previous upward momentum and laid the groundwork for a structural downtrend.
Subsequent CHoCH Formations: As the market progressed, intermediate CHoCH levels continued to form. These act as secondary confirmation signals, indicating that every minor recovery attempt by buyers is quickly thwarted by dominant sellers, cementing the continuation of the bearish bias.
3. Dynamic Supporting Trendline:
What it is: A sharply sloping Supporting Trendline connects the descending swing highs on the daily timeframe.
Role in Market: While often referred to as a resistance trendline by retail traders, in this context, it acts as a dynamic ceiling that tracks the velocity of the decline. Every time the price attempts a corrective pullback, it respects this boundary and gets driven downwards. Sellers actively monitor this trendline to locate high-probability entries in alignment with the broader trend.
4. BOS (Break of Structure):
What is a BOS? A Break of Structure (BOS) occurs when the market decisively breaks a significant internal or external swing low (in a downtrend) or swing high (in an uptrend) and closes beyond it, confirming the continuation of the prevailing trend.
Significance on the Chart: The chart displays a clean BOS formation as price punches through previous support levels. This structural break proves that the bears are in complete control of the order flow. The momentum accelerates post-breakout, trapping late retail buyers and triggering cascading liquidations beneath previous lows.
5. 20-Day IPDA (Interbank Price Delivery Algorithm) & Target Projections:
What it is: The 20-Day IPDA level marks a crucial institutional benchmark used to analyze how liquidity and price delivery operate over a rolling 20-day delivery cycle.
Outlook & Target Direction: Combined with the aggressive downward arrow, the confluence of the trendline rejection, the recent BOS, and the IPDA reference points suggest that the market is primed for further downside expansion. Price is anticipated to target lower liquidity pools and unmitigated demand zones further down on the daily chart.
Disclaimer: This analysis is strictly for educational, informational, and analytical purposes and does not constitute financial advice. Always perform your own due diligence, risk management, and multi-timeframe analysis before executing any trades in the financial markets.
1. Premium Rejection Zone (Supply/Resistance):
What it is: At the top of the chart, a wide horizontal block is marked as the Rejection Zone. This zone represents a high-timeframe institutional supply area where heavy selling pressure previously entered the market.
Market Behavior: Whenever price retraces back up into this premium zone, institutional sellers aggressively step in to push the price lower. It acts as a critical ceiling that protects the overarching macro downtrend, ensuring that buyers are unable to sustain higher prices.
2. Market Structure Shift (CHoCH - Change of Character):
Major CHoCH: The chart highlights a Major CHoCH early in the sequence. A Change of Character (CHoCH) signifies a critical transition point where market sentiment shifts from bullish to bearish (or vice versa). This particular major shift invalidated the previous upward momentum and laid the groundwork for a structural downtrend.
Subsequent CHoCH Formations: As the market progressed, intermediate CHoCH levels continued to form. These act as secondary confirmation signals, indicating that every minor recovery attempt by buyers is quickly thwarted by dominant sellers, cementing the continuation of the bearish bias.
3. Dynamic Supporting Trendline:
What it is: A sharply sloping Supporting Trendline connects the descending swing highs on the daily timeframe.
Role in Market: While often referred to as a resistance trendline by retail traders, in this context, it acts as a dynamic ceiling that tracks the velocity of the decline. Every time the price attempts a corrective pullback, it respects this boundary and gets driven downwards. Sellers actively monitor this trendline to locate high-probability entries in alignment with the broader trend.
4. BOS (Break of Structure):
What is a BOS? A Break of Structure (BOS) occurs when the market decisively breaks a significant internal or external swing low (in a downtrend) or swing high (in an uptrend) and closes beyond it, confirming the continuation of the prevailing trend.
Significance on the Chart: The chart displays a clean BOS formation as price punches through previous support levels. This structural break proves that the bears are in complete control of the order flow. The momentum accelerates post-breakout, trapping late retail buyers and triggering cascading liquidations beneath previous lows.
5. 20-Day IPDA (Interbank Price Delivery Algorithm) & Target Projections:
What it is: The 20-Day IPDA level marks a crucial institutional benchmark used to analyze how liquidity and price delivery operate over a rolling 20-day delivery cycle.
Outlook & Target Direction: Combined with the aggressive downward arrow, the confluence of the trendline rejection, the recent BOS, and the IPDA reference points suggest that the market is primed for further downside expansion. Price is anticipated to target lower liquidity pools and unmitigated demand zones further down on the daily chart.
Disclaimer: This analysis is strictly for educational, informational, and analytical purposes and does not constitute financial advice. Always perform your own due diligence, risk management, and multi-timeframe analysis before executing any trades in the financial markets.
ملاحظة
Market Structure and Price Action Insights (Gold - 1D Timeframe):Rejection Zone Behavior: Price has consistently respected the higher-timeframe Rejection Zone, highlighting heavy institutional supply and aggressive selling pressure whenever retests occur.
Structural Shifts (CHoCH): The evolution from a Major CHoCH to subsequent minor CHoCH formations marks a structural shift in market sentiment, transitioning the bias firmly from bullish to bearish.
Trendline Dynamics: The Supporting Trendline acts as a dynamic ceiling, guiding the downward momentum as corrective pullbacks continue to get sold into.
Continuation via BOS: A clear Break of Structure (BOS) confirms that bears have seized control, breaking previous swing lows and accelerating momentum toward the 20 Day IPDA reference levels.
Note: Use this structure to analyze how liquidity delivery aligns with multi-timeframe trend continuation

Follow The Trend Not a Crowd
Join My Free Telegram Signal
t.me/+K6J2uweHFzxiNDFk
Join My Free Telegram Signal
t.me/+K6J2uweHFzxiNDFk
إخلاء المسؤولية
لا يُقصد بالمعلومات والمنشورات أن تكون، أو تشكل، أي نصيحة مالية أو استثمارية أو تجارية أو أنواع أخرى من النصائح أو التوصيات المقدمة أو المعتمدة من TradingView. اقرأ المزيد في شروط الاستخدام.
Follow The Trend Not a Crowd
Join My Free Telegram Signal
t.me/+K6J2uweHFzxiNDFk
Join My Free Telegram Signal
t.me/+K6J2uweHFzxiNDFk
إخلاء المسؤولية
لا يُقصد بالمعلومات والمنشورات أن تكون، أو تشكل، أي نصيحة مالية أو استثمارية أو تجارية أو أنواع أخرى من النصائح أو التوصيات المقدمة أو المعتمدة من TradingView. اقرأ المزيد في شروط الاستخدام.