
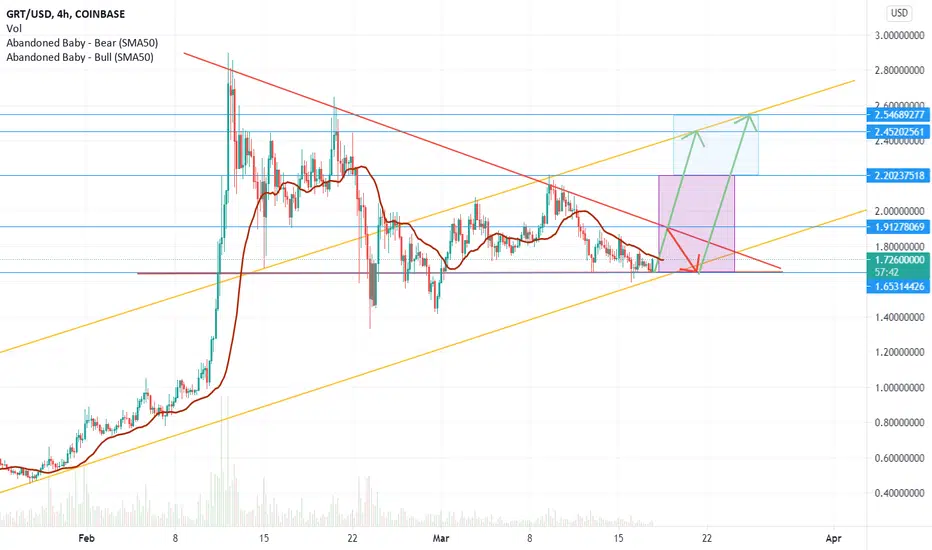
The graph has been consolidating in this bullish flag for almost an entire month. Two possible scenarios could playout:
First: GRT could bounce off the top trendline of the flag at $1.91 descending back to $1.65 price range, which has shown very strong support, before breaking out and uptrending to $2.54 price
Second: It bust through the top trend line passing $1.91 then on to retest $2.20 before ending up at the $2.45 TP
First: GRT could bounce off the top trendline of the flag at $1.91 descending back to $1.65 price range, which has shown very strong support, before breaking out and uptrending to $2.54 price
Second: It bust through the top trend line passing $1.91 then on to retest $2.20 before ending up at the $2.45 TP

إخلاء المسؤولية
لا يُقصد بالمعلومات والمنشورات أن تكون، أو تشكل، أي نصيحة مالية أو استثمارية أو تجارية أو أنواع أخرى من النصائح أو التوصيات المقدمة أو المعتمدة من TradingView. اقرأ المزيد في شروط الاستخدام.
إخلاء المسؤولية
لا يُقصد بالمعلومات والمنشورات أن تكون، أو تشكل، أي نصيحة مالية أو استثمارية أو تجارية أو أنواع أخرى من النصائح أو التوصيات المقدمة أو المعتمدة من TradingView. اقرأ المزيد في شروط الاستخدام.