
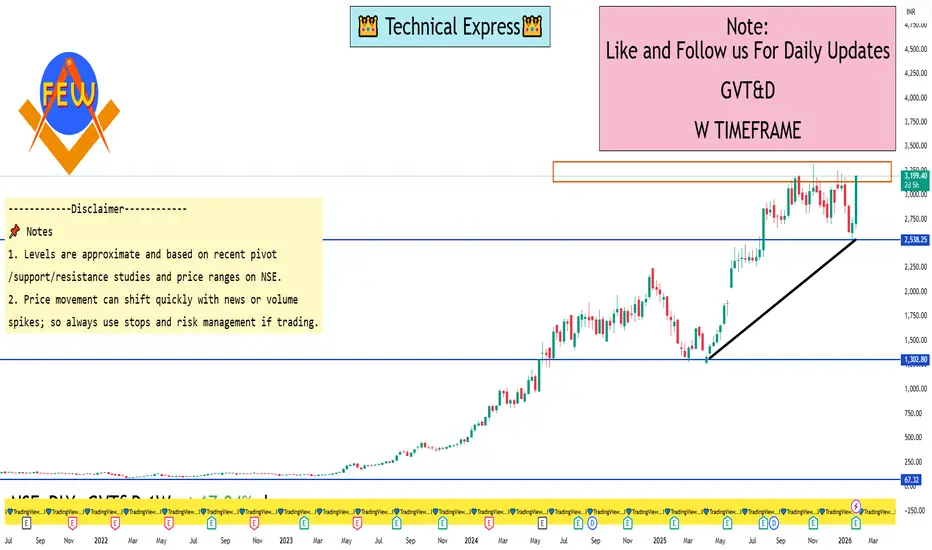
📊 Current context (end-Jan 2026):
The stock is trading near ₹3,100-₹3,200 levels recently.
📈 Resistance Levels (Upside Targets)
1. ~₹3,170 – ₹3,200
– Near recent intraday highs and short-term caps on rallies.
2. ~₹3,250 – ₹3,324
– Approaching the 52-week high zone (~₹3,323.8).
3. ~₹3,350 +
– Above the prior yearly highs — next structural resistance if breakout confirmed.
📉 Support Levels (Downside Floors)
1. ~₹2,670 – ₹2,680
– First solid support zone from pivot analyses & moving averages.
2. ~₹2,600 – ₹2,610
– Secondary support around longer-term EMA levels / 200-day average and prior consolidations.
3. ~₹2,520 – ₹2,550
– Lower support in case of deeper correction — near the 1-week recent low zone.
🔄 Pivot & Momentum Signals
Technical tools (e.g., trading platforms) suggest mixed/neutral to moderately bullish momentum in the 1-week context, with some indicators leaning positive but others neutral.
The stock is trading near ₹3,100-₹3,200 levels recently.
📈 Resistance Levels (Upside Targets)
1. ~₹3,170 – ₹3,200
– Near recent intraday highs and short-term caps on rallies.
2. ~₹3,250 – ₹3,324
– Approaching the 52-week high zone (~₹3,323.8).
3. ~₹3,350 +
– Above the prior yearly highs — next structural resistance if breakout confirmed.
📉 Support Levels (Downside Floors)
1. ~₹2,670 – ₹2,680
– First solid support zone from pivot analyses & moving averages.
2. ~₹2,600 – ₹2,610
– Secondary support around longer-term EMA levels / 200-day average and prior consolidations.
3. ~₹2,520 – ₹2,550
– Lower support in case of deeper correction — near the 1-week recent low zone.
🔄 Pivot & Momentum Signals
Technical tools (e.g., trading platforms) suggest mixed/neutral to moderately bullish momentum in the 1-week context, with some indicators leaning positive but others neutral.

منشورات ذات صلة
إخلاء المسؤولية
لا يُقصد بالمعلومات والمنشورات أن تكون، أو تشكل، أي نصيحة مالية أو استثمارية أو تجارية أو أنواع أخرى من النصائح أو التوصيات المقدمة أو المعتمدة من TradingView. اقرأ المزيد في شروط الاستخدام.
منشورات ذات صلة
إخلاء المسؤولية
لا يُقصد بالمعلومات والمنشورات أن تكون، أو تشكل، أي نصيحة مالية أو استثمارية أو تجارية أو أنواع أخرى من النصائح أو التوصيات المقدمة أو المعتمدة من TradingView. اقرأ المزيد في شروط الاستخدام.