
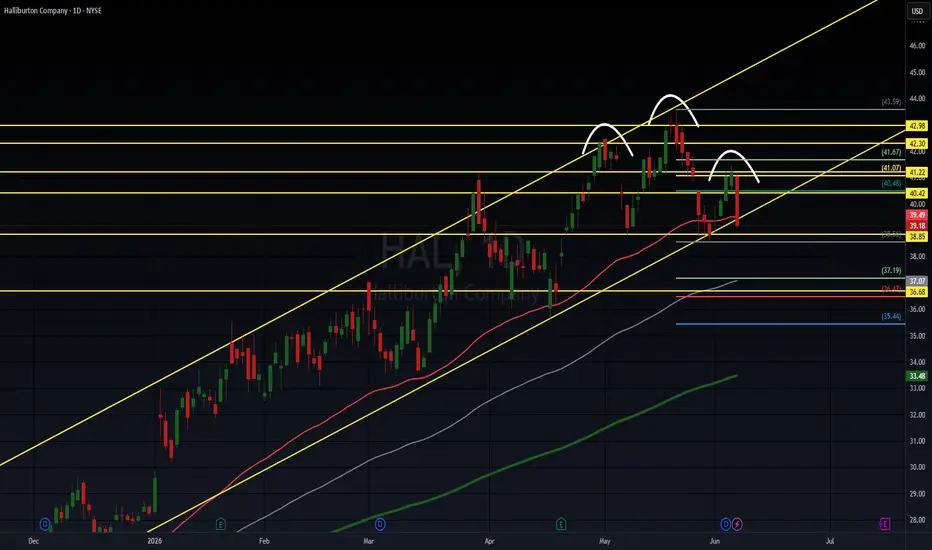
 HAL remains in a longer-term uptrend, trading above its rising 100 EMA (gray) and 200 EMA (green), but recent price action is showing signs of weakening momentum near resistance.
Price has formed a series of lower highs in the $41.00–$43.50 zone, highlighted by multiple failed breakout attempts. The inability to sustain moves above the resistance cluster around $42.30–$42.98 suggests sellers remain active at higher levels.
The stock is currently testing the lower boundary of its ascending channel while sitting near the 50 EMA (red). This area around $38.85–$39.50 is a critical support zone. A successful defense here could trigger another move toward $41.22, $42.30, and eventually $42.98–$43.59.
On the downside, a decisive breakdown below $38.85 would weaken the bullish channel structure and expose lower support levels near $37.19, $36.68, and $35.44. The rising 100 EMA near the mid-$36 area may provide additional support if selling pressure increases.
Key Resistance Levels:
* 41.22
* 42.30
* 42.98
* 43.59
Key Support Levels:
* 39.49
* 38.85
* 37.19
* 36.68
* 35.44
Trend Assessment:
* Short-term: Neutral to Bearish
* Intermediate-term: Bullish above the 100 EMA
* Long-term: Bullish above the 200 EMA

إخلاء المسؤولية
لا يُقصد بالمعلومات والمنشورات أن تكون، أو تشكل، أي نصيحة مالية أو استثمارية أو تجارية أو أنواع أخرى من النصائح أو التوصيات المقدمة أو المعتمدة من TradingView. اقرأ المزيد في شروط الاستخدام.
إخلاء المسؤولية
لا يُقصد بالمعلومات والمنشورات أن تكون، أو تشكل، أي نصيحة مالية أو استثمارية أو تجارية أو أنواع أخرى من النصائح أو التوصيات المقدمة أو المعتمدة من TradingView. اقرأ المزيد في شروط الاستخدام.