
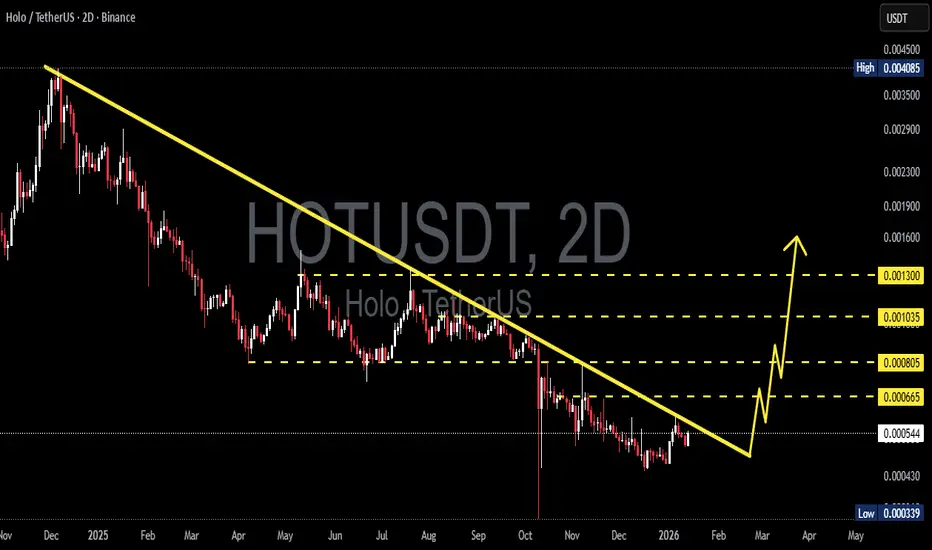
The HOT/USDT pair on the 2D timeframe remains in a long-term downtrend since the late-2024 peak. Price continues to form lower highs and lower lows, confirming strong seller dominance. Currently, price is consolidating after a sharp decline, positioned just below the major descending trendline.
---
Pattern Explanation
The chart clearly shows a Descending Trendline (Bearish Market Structure) that has been tested multiple times since early 2025 and has not been broken with valid confirmation.
Pattern characteristics:
A downward-sloping trendline originating from the major distribution high.
Each rebound fails to create a higher high.
Consolidation occurs below the trendline, indicating a bearish continuation structure.
Additional structure:
A tight range formed between 0.000665 – 0.000805
This reflects price compression, which often precedes an impulsive move (breakout or breakdown).
---
Key Levels
Resistance (Supply Zone):
0.000665
0.000805
0.001035
0.001300
Support (Demand Zone):
0.000544 (current area)
0.000430
0.000339 (major low)
---
Bullish Scenario
The bullish scenario is counter-trend and only valid with strong confirmation.
Bullish requirements:
1. Price breaks and closes above the descending trendline
2. Follow-through candles hold above 0.000665
3. Ideally supported by increasing volume
Bullish targets:
0.000805
0.001035
0.001300
Note:
As long as price remains below the trendline, any upside move should be considered a relief rally, not a full trend reversal.
---
Bearish Scenario
This remains the primary high-probability scenario based on current structure.
Bearish confirmation:
1. Rejection from the descending trendline
2. Breakdown below 0.000544 support
3. Strong candle close beneath the consolidation range
Downside targets:
0.000430
0.000339 (previous low / strong demand zone)
If 0.000339 fails, HOT may enter an extended accumulation or capitulation phase.
---
Conclusion
HOT/USDT is still trading within a bearish market structure with dominant selling pressure. The current consolidation sits directly below the descending trendline, making this zone extremely critical.
Traders are advised to:
Wait for confirmation before considering bullish entries
Respect bearish continuation as long as price stays below key resistance
Discipline and confirmation remain essential.
#HOTUSDT #HOLO #CryptoAnalysis #TechnicalAnalysis #BearishTrend #DescendingTrendline #AltcoinMarket #SupportResistance #PriceAction
---
Pattern Explanation
The chart clearly shows a Descending Trendline (Bearish Market Structure) that has been tested multiple times since early 2025 and has not been broken with valid confirmation.
Pattern characteristics:
A downward-sloping trendline originating from the major distribution high.
Each rebound fails to create a higher high.
Consolidation occurs below the trendline, indicating a bearish continuation structure.
Additional structure:
A tight range formed between 0.000665 – 0.000805
This reflects price compression, which often precedes an impulsive move (breakout or breakdown).
---
Key Levels
Resistance (Supply Zone):
0.000665
0.000805
0.001035
0.001300
Support (Demand Zone):
0.000544 (current area)
0.000430
0.000339 (major low)
---
Bullish Scenario
The bullish scenario is counter-trend and only valid with strong confirmation.
Bullish requirements:
1. Price breaks and closes above the descending trendline
2. Follow-through candles hold above 0.000665
3. Ideally supported by increasing volume
Bullish targets:
0.000805
0.001035
0.001300
Note:
As long as price remains below the trendline, any upside move should be considered a relief rally, not a full trend reversal.
---
Bearish Scenario
This remains the primary high-probability scenario based on current structure.
Bearish confirmation:
1. Rejection from the descending trendline
2. Breakdown below 0.000544 support
3. Strong candle close beneath the consolidation range
Downside targets:
0.000430
0.000339 (previous low / strong demand zone)
If 0.000339 fails, HOT may enter an extended accumulation or capitulation phase.
---
Conclusion
HOT/USDT is still trading within a bearish market structure with dominant selling pressure. The current consolidation sits directly below the descending trendline, making this zone extremely critical.
Traders are advised to:
Wait for confirmation before considering bullish entries
Respect bearish continuation as long as price stays below key resistance
Discipline and confirmation remain essential.
#HOTUSDT #HOLO #CryptoAnalysis #TechnicalAnalysis #BearishTrend #DescendingTrendline #AltcoinMarket #SupportResistance #PriceAction

✅ Get Free Signals! Join Our Telegram Channel Here: t.me/TheCryptoNuclear
✅ Twitter: twitter.com/crypto_nuclear
✅ Join Bybit : partner.bybit.com/b/nuclearvip
✅ Benefits : Lifetime Trading Fee Discount -50%
✅ Twitter: twitter.com/crypto_nuclear
✅ Join Bybit : partner.bybit.com/b/nuclearvip
✅ Benefits : Lifetime Trading Fee Discount -50%
إخلاء المسؤولية
لا يُقصد بالمعلومات والمنشورات أن تكون، أو تشكل، أي نصيحة مالية أو استثمارية أو تجارية أو أنواع أخرى من النصائح أو التوصيات المقدمة أو المعتمدة من TradingView. اقرأ المزيد في شروط الاستخدام.
✅ Get Free Signals! Join Our Telegram Channel Here: t.me/TheCryptoNuclear
✅ Twitter: twitter.com/crypto_nuclear
✅ Join Bybit : partner.bybit.com/b/nuclearvip
✅ Benefits : Lifetime Trading Fee Discount -50%
✅ Twitter: twitter.com/crypto_nuclear
✅ Join Bybit : partner.bybit.com/b/nuclearvip
✅ Benefits : Lifetime Trading Fee Discount -50%
إخلاء المسؤولية
لا يُقصد بالمعلومات والمنشورات أن تكون، أو تشكل، أي نصيحة مالية أو استثمارية أو تجارية أو أنواع أخرى من النصائح أو التوصيات المقدمة أو المعتمدة من TradingView. اقرأ المزيد في شروط الاستخدام.