
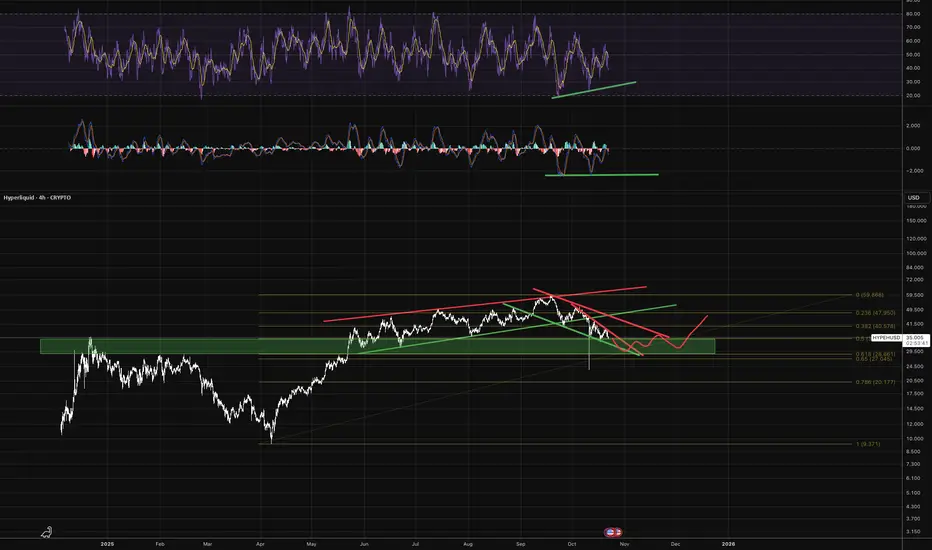
This 4-hour chart for HYPEUSD (Hyperliquid) showcases a technical setup with a clear top-down analysis, including higher time frame Fibonacci retracement levels, key support/resistance zones, pattern formations, and oscillator signals to support a potential trade idea.
Technical Structure
Trend Overview: The chart presents a prolonged uptrend culminating in a broad, topping distribution (red resistance lines), followed by a consistent decline forming a downward channel (red parallel lines).
Support Zone: Price has recently retraced into a dense green demand zone ($28.66–$34.05, corresponding to the 0.618–0.65 fib region), historically significant as previous resistance turned support.
Fibonacci Levels: Notable Fibonacci clusters are drawn, with 0.618/0.65 retracement aligning with the green zone as immediate support, while 0.382 acts as initial upside resistance ($40.57). Higher resistance targets are $47.96 (0.236) and cycle high at $59.86 (1.0).
Projected Scenario: The immediate thesis anticipates a potential bullish reaction off the demand zone. The red trajectory envisions initial choppy consolidation followed by a rally toward $41–$42 (0.382 fib). Failure to hold the green box could see further capitulation into the $20.17 level (0.786 fib).
Oscillator and Momentum
RSI (top panel): There is a bullish divergence forming; while price makes lower lows, RSI prints higher lows, suggesting sellers are losing momentum and a relief bounce is likely.
MACD (second panel): The MACD histogram and signal lines also display bullish divergence and attempt to cross upwards, supporting the idea of a local reversal.
Trade Idea and Risk Management
Entry: Consider long in the $28.6–$34 area, ideally scaling in as price tests and consolidates within the green zone.
Profit Targets: 1st target at $40.57 (0.382 fib), 2nd target at $47.96 (0.236 fib), and a moonshot target at $59.86 should momentum strongly recover.
Stop Loss: A logical stop is below $28.6 (the lower boundary of the green demand zone and 0.65 fib). For a wider safety net, use the 0.786 fib at $20.17 as a hard invalidation.
Summary and Rationale
Supportive indicators (RSI/MACD divergence), major fib confluence, and history of strong reactions at this zone back the case for a tactical long. The setup also offers a well-defined risk/reward structure with explicit invalidation below $28.6 and clear upside targets, aligning with best practices of a clearly stated thesis and risk management discipline.
Technical Structure
Trend Overview: The chart presents a prolonged uptrend culminating in a broad, topping distribution (red resistance lines), followed by a consistent decline forming a downward channel (red parallel lines).
Support Zone: Price has recently retraced into a dense green demand zone ($28.66–$34.05, corresponding to the 0.618–0.65 fib region), historically significant as previous resistance turned support.
Fibonacci Levels: Notable Fibonacci clusters are drawn, with 0.618/0.65 retracement aligning with the green zone as immediate support, while 0.382 acts as initial upside resistance ($40.57). Higher resistance targets are $47.96 (0.236) and cycle high at $59.86 (1.0).
Projected Scenario: The immediate thesis anticipates a potential bullish reaction off the demand zone. The red trajectory envisions initial choppy consolidation followed by a rally toward $41–$42 (0.382 fib). Failure to hold the green box could see further capitulation into the $20.17 level (0.786 fib).
Oscillator and Momentum
RSI (top panel): There is a bullish divergence forming; while price makes lower lows, RSI prints higher lows, suggesting sellers are losing momentum and a relief bounce is likely.
MACD (second panel): The MACD histogram and signal lines also display bullish divergence and attempt to cross upwards, supporting the idea of a local reversal.
Trade Idea and Risk Management
Entry: Consider long in the $28.6–$34 area, ideally scaling in as price tests and consolidates within the green zone.
Profit Targets: 1st target at $40.57 (0.382 fib), 2nd target at $47.96 (0.236 fib), and a moonshot target at $59.86 should momentum strongly recover.
Stop Loss: A logical stop is below $28.6 (the lower boundary of the green demand zone and 0.65 fib). For a wider safety net, use the 0.786 fib at $20.17 as a hard invalidation.
Summary and Rationale
Supportive indicators (RSI/MACD divergence), major fib confluence, and history of strong reactions at this zone back the case for a tactical long. The setup also offers a well-defined risk/reward structure with explicit invalidation below $28.6 and clear upside targets, aligning with best practices of a clearly stated thesis and risk management discipline.

إخلاء المسؤولية
لا يُقصد بالمعلومات والمنشورات أن تكون، أو تشكل، أي نصيحة مالية أو استثمارية أو تجارية أو أنواع أخرى من النصائح أو التوصيات المقدمة أو المعتمدة من TradingView. اقرأ المزيد في شروط الاستخدام.
إخلاء المسؤولية
لا يُقصد بالمعلومات والمنشورات أن تكون، أو تشكل، أي نصيحة مالية أو استثمارية أو تجارية أو أنواع أخرى من النصائح أو التوصيات المقدمة أو المعتمدة من TradingView. اقرأ المزيد في شروط الاستخدام.