
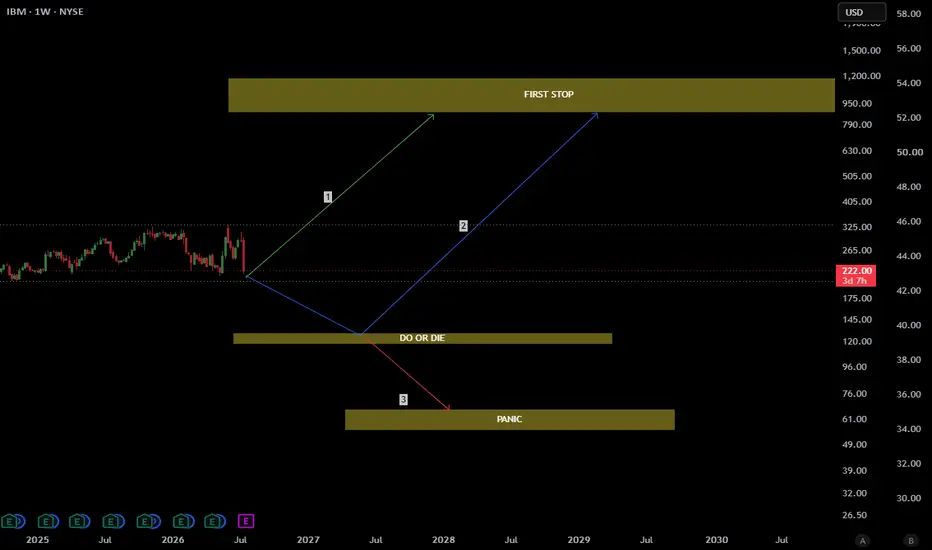
Some charts require interpretation. This one required labels, so we gave the zones their proper names: First Stop, Do or Die, and Panic. The map explains itself.
IBM has spent over a year building a wide distribution range, and price is now breaking down from the bottom of it. On a weekly timeframe, that is not noise, that is a decision. What happens next plays out over years, not weeks, and we see three paths.
Path 1: The breakdown turns out to be the fakeout. Buyers reclaim the range immediately, the shakeout traps the sellers, and price begins the long climb toward the First Stop zone high above. The strongest version of the bull case, and the least patient one.
Path 2: The honest path. The breakdown follows through and price descends into the Do or Die zone, the last major structural support on the chart. The name is not decoration. If buyers show up there with conviction, the entire correction becomes the launchpad, and the destination is the same First Stop, just on a longer road.
Path 3: Do or Die, and the answer is die. Support fails, conviction evaporates, and price capitulates into the Panic zone below. That is where forced sellers finish and generational buyers begin. If price ever prints there, fear will be the loudest voice in the room, which is usually the moment it stops being right.
Notice the asymmetry: two of the three paths end at the First Stop. Even the ugly one likely resolves higher eventually, it just charges a much steeper emotional toll on the way.
We are not predicting which road IBM takes. We are watching how price reacts at each zone, because the reaction is the only signal that pays.
EQC follows the reaction.
Hidden in plain sight. EQC.
Like, Follow, Boost, Join, Thank You!
Financial Disclaimer: This post is not financial advice. I am not your financial advisor, your crypto influencer, or your emergency hotline when volatility discovers your stop loss. Always do your own research and never trade solely because colorful arrows suggest a brighter future.
IBM has spent over a year building a wide distribution range, and price is now breaking down from the bottom of it. On a weekly timeframe, that is not noise, that is a decision. What happens next plays out over years, not weeks, and we see three paths.
Path 1: The breakdown turns out to be the fakeout. Buyers reclaim the range immediately, the shakeout traps the sellers, and price begins the long climb toward the First Stop zone high above. The strongest version of the bull case, and the least patient one.
Path 2: The honest path. The breakdown follows through and price descends into the Do or Die zone, the last major structural support on the chart. The name is not decoration. If buyers show up there with conviction, the entire correction becomes the launchpad, and the destination is the same First Stop, just on a longer road.
Path 3: Do or Die, and the answer is die. Support fails, conviction evaporates, and price capitulates into the Panic zone below. That is where forced sellers finish and generational buyers begin. If price ever prints there, fear will be the loudest voice in the room, which is usually the moment it stops being right.
Notice the asymmetry: two of the three paths end at the First Stop. Even the ugly one likely resolves higher eventually, it just charges a much steeper emotional toll on the way.
We are not predicting which road IBM takes. We are watching how price reacts at each zone, because the reaction is the only signal that pays.
EQC follows the reaction.
Hidden in plain sight. EQC.
Like, Follow, Boost, Join, Thank You!
Financial Disclaimer: This post is not financial advice. I am not your financial advisor, your crypto influencer, or your emergency hotline when volatility discovers your stop loss. Always do your own research and never trade solely because colorful arrows suggest a brighter future.

إخلاء المسؤولية
لا يُقصد بالمعلومات والمنشورات أن تكون، أو تشكل، أي نصيحة مالية أو استثمارية أو تجارية أو أنواع أخرى من النصائح أو التوصيات المقدمة أو المعتمدة من TradingView. اقرأ المزيد في شروط الاستخدام.
إخلاء المسؤولية
لا يُقصد بالمعلومات والمنشورات أن تكون، أو تشكل، أي نصيحة مالية أو استثمارية أو تجارية أو أنواع أخرى من النصائح أو التوصيات المقدمة أو المعتمدة من TradingView. اقرأ المزيد في شروط الاستخدام.