
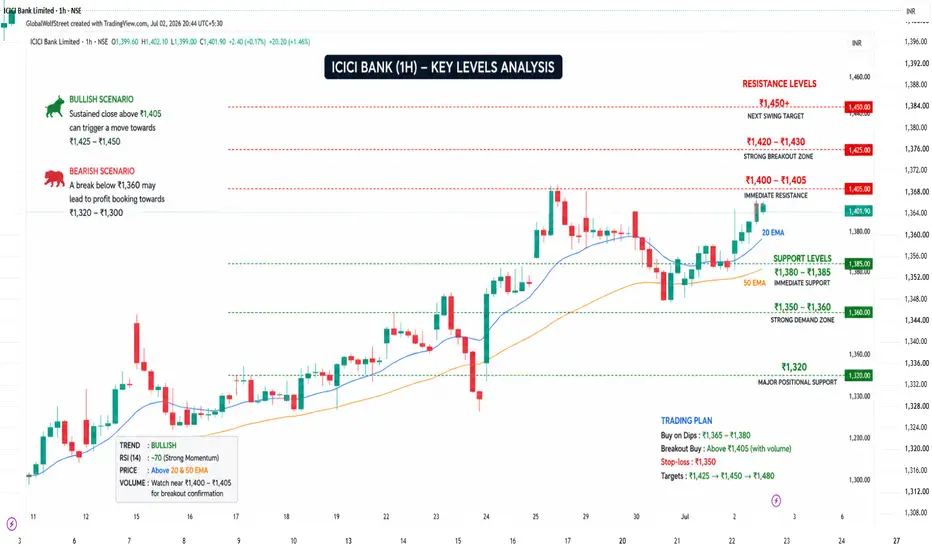
Key Levels
Resistance
₹1,400–1,405 – Immediate resistance
₹1,420–1,430 – Strong breakout zone
₹1,450+ – Next swing target if breakout sustains
Support
₹1,380–1,385 – Immediate support
₹1,350–1,360 – Strong demand zone
₹1,320 – Major positional support
Trading View
🟢 Bullish Scenario
Sustained close above ₹1,405 can trigger a move towards ₹1,425–1,450.
Trend remains positive while the stock trades above ₹1,360.
🔴 Bearish Scenario
A break below ₹1,360 may lead to profit booking towards ₹1,320–1,300.
Swing Trading Plan
Buy on dips: ₹1,365–1,380
Breakout buy: Above ₹1,405 with strong volume
Stop-loss: ₹1,350 (or according to your risk management)
Targets: ₹1,425 → ₹1,450 → ₹1,480
Technical Indicators
✅ Trend: Bullish
✅ RSI: Around 70 (strong momentum but near overbought)
✅ Price is above key moving averages
⚠️ Watch volume closely near ₹1,400–1,405 for confirmation of a breakout.

منشورات ذات صلة
إخلاء المسؤولية
لا يُقصد بالمعلومات والمنشورات أن تكون، أو تشكل، أي نصيحة مالية أو استثمارية أو تجارية أو أنواع أخرى من النصائح أو التوصيات المقدمة أو المعتمدة من TradingView. اقرأ المزيد في شروط الاستخدام.
منشورات ذات صلة
إخلاء المسؤولية
لا يُقصد بالمعلومات والمنشورات أن تكون، أو تشكل، أي نصيحة مالية أو استثمارية أو تجارية أو أنواع أخرى من النصائح أو التوصيات المقدمة أو المعتمدة من TradingView. اقرأ المزيد في شروط الاستخدام.