
The Macro Picture 🗺️
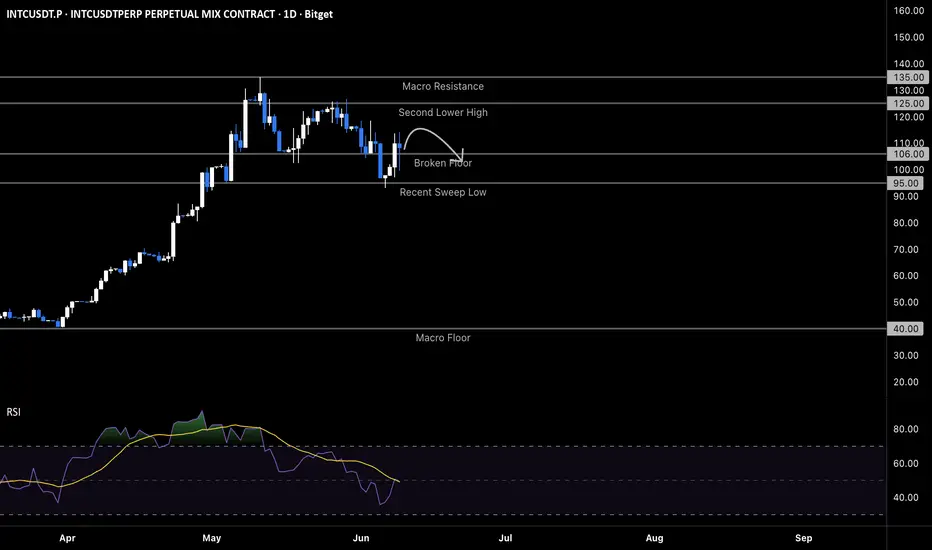
INTC has completed the first wave of its post-parabolic correction — price flushed through the $106 horizontal floor and wicked deep into the $95 liquidity pocket before bulls produced a reactive bounce off the deeper level. That sweep cleared out over-leveraged longs and reset oversold momentum, but the broader structure remains intact: lower highs at $135, $130, and $125, with a broken floor now sitting overhead as supply. Price has rallied straight into the underside of the $106 band, and this is where the bear flag either confirms or fails.
The Setup ⚙️
The Support Flip: The $106 level was the structure's last line of defense and has now flipped into overhead resistance — the path of least resistance for sellers is to defend this band on the first retest and reject price back into the lower range.
The Reaction: The sharp recovery from the $95 sweep low has the shape of a reactive bounce rather than a structural reclaim, with RSI lifting off the oversold zone but still capped below the mid-line — momentum has cooled but not reversed.
The Trigger: A rejection wick from the $106–$115 band followed by a 1D close back below $106 confirms the bear flag and reopens the path toward the $95 sweep low for a retest, with sell stops sitting just below.
The Roadmap: Primary target sits at $95 — the white projection traces a shallow relief push into the broken-floor supply followed by a clean rejection back toward the recent sweep low. Invalidation: a sustained 1D close above $115 would invalidate this bearish thesis and reopen the path toward the $125 lower-high band.
INTC has completed the first wave of its post-parabolic correction — price flushed through the $106 horizontal floor and wicked deep into the $95 liquidity pocket before bulls produced a reactive bounce off the deeper level. That sweep cleared out over-leveraged longs and reset oversold momentum, but the broader structure remains intact: lower highs at $135, $130, and $125, with a broken floor now sitting overhead as supply. Price has rallied straight into the underside of the $106 band, and this is where the bear flag either confirms or fails.
The Setup ⚙️
The Support Flip: The $106 level was the structure's last line of defense and has now flipped into overhead resistance — the path of least resistance for sellers is to defend this band on the first retest and reject price back into the lower range.
The Reaction: The sharp recovery from the $95 sweep low has the shape of a reactive bounce rather than a structural reclaim, with RSI lifting off the oversold zone but still capped below the mid-line — momentum has cooled but not reversed.
The Trigger: A rejection wick from the $106–$115 band followed by a 1D close back below $106 confirms the bear flag and reopens the path toward the $95 sweep low for a retest, with sell stops sitting just below.
The Roadmap: Primary target sits at $95 — the white projection traces a shallow relief push into the broken-floor supply followed by a clean rejection back toward the recent sweep low. Invalidation: a sustained 1D close above $115 would invalidate this bearish thesis and reopen the path toward the $125 lower-high band.

📈 Stop guessing your settings — backtest & optimize with QuantPilot
🎁 Free to start
🎁 Free to start
إخلاء المسؤولية
لا يُقصد بالمعلومات والمنشورات أن تكون، أو تشكل، أي نصيحة مالية أو استثمارية أو تجارية أو أنواع أخرى من النصائح أو التوصيات المقدمة أو المعتمدة من TradingView. اقرأ المزيد في شروط الاستخدام.
📈 Stop guessing your settings — backtest & optimize with QuantPilot
🎁 Free to start
🎁 Free to start
إخلاء المسؤولية
لا يُقصد بالمعلومات والمنشورات أن تكون، أو تشكل، أي نصيحة مالية أو استثمارية أو تجارية أو أنواع أخرى من النصائح أو التوصيات المقدمة أو المعتمدة من TradingView. اقرأ المزيد في شروط الاستخدام.