IOTAUSD - 1D Chart Analysis
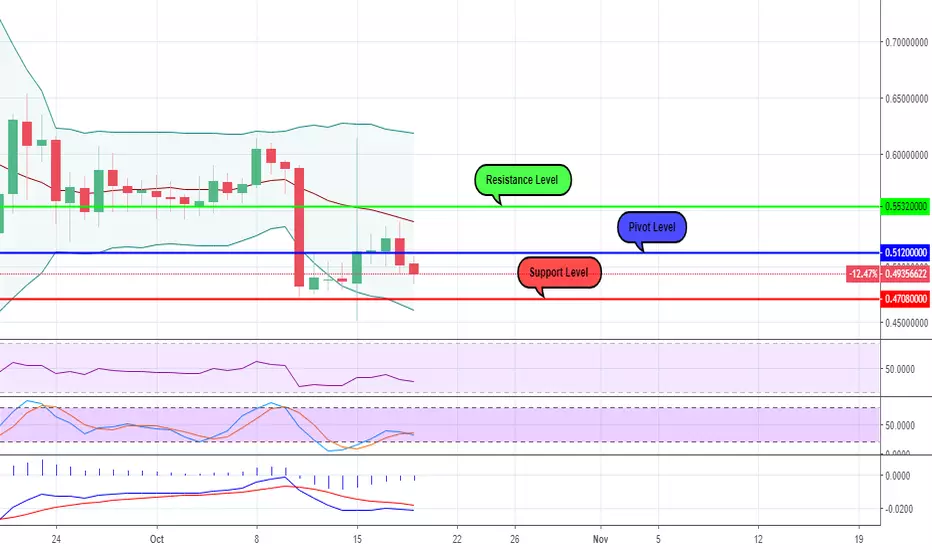
After yesterday's failed attempt of crossing the 20 days Moving Average, we could see today another negative evolution of the price, confirming the bearish trend which started on the 11th of October.
Other factors that we might consider for this scenario would be the RSI which seems that is heading to the "oversold" area, the Stochastic's crossover which is indicating that the price will start to decrease and the MACD which is clearly indicating that the downtrend is not finished yet.
As possible targets, we can first consider 0.4708$ or 0.4600$ in extension.
Other factors that we might consider for this scenario would be the RSI which seems that is heading to the "oversold" area, the Stochastic's crossover which is indicating that the price will start to decrease and the MACD which is clearly indicating that the downtrend is not finished yet.
As possible targets, we can first consider 0.4708$ or 0.4600$ in extension.

منشورات ذات صلة
إخلاء المسؤولية
لا يُقصد بالمعلومات والمنشورات أن تكون، أو تشكل، أي نصيحة مالية أو استثمارية أو تجارية أو أنواع أخرى من النصائح أو التوصيات المقدمة أو المعتمدة من TradingView. اقرأ المزيد في شروط الاستخدام.
منشورات ذات صلة
إخلاء المسؤولية
لا يُقصد بالمعلومات والمنشورات أن تكون، أو تشكل، أي نصيحة مالية أو استثمارية أو تجارية أو أنواع أخرى من النصائح أو التوصيات المقدمة أو المعتمدة من TradingView. اقرأ المزيد في شروط الاستخدام.