
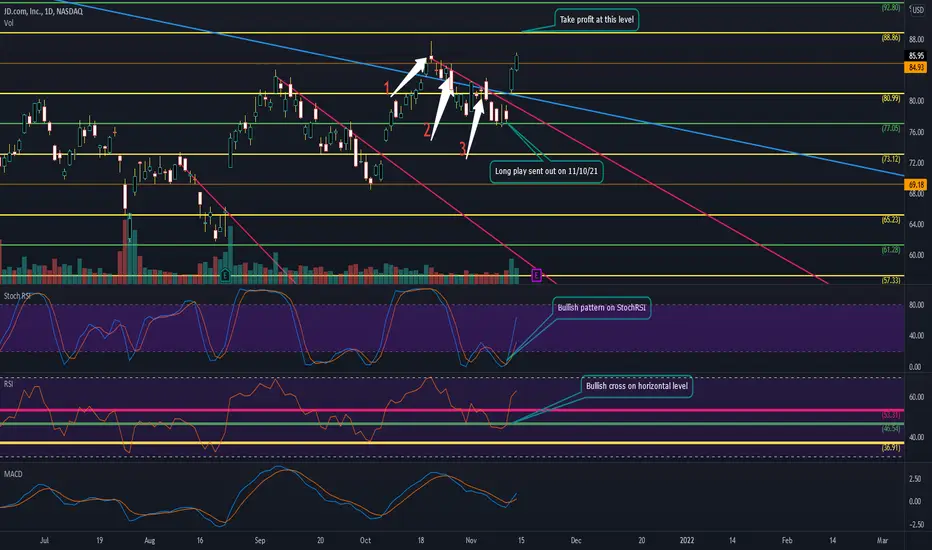
I am bullish on JD in the short term based on the following:
20th Oct - 8th Nov - JD had 3 waves down; and on the 8th Nov, it found support and closed above a key level. After 3 waves down, based on what I have seen, there is usually a change in direction.
9th Nov - A bullish inverted hammer candle was formed and it closed above $77.05.
10th Nov - I entered a long position based on the aforementioned items, in addition to the formation of the StochRSI and the break of the static horizontal level on RSI.
My strategy dictates, after back testing, that i take profits, four levels up from my initial entry, which will be @ $88.86.
Thank you for your time.
20th Oct - 8th Nov - JD had 3 waves down; and on the 8th Nov, it found support and closed above a key level. After 3 waves down, based on what I have seen, there is usually a change in direction.
9th Nov - A bullish inverted hammer candle was formed and it closed above $77.05.
10th Nov - I entered a long position based on the aforementioned items, in addition to the formation of the StochRSI and the break of the static horizontal level on RSI.
My strategy dictates, after back testing, that i take profits, four levels up from my initial entry, which will be @ $88.86.
Thank you for your time.
ملاحظة
Closed the trade today
إخلاء المسؤولية
لا يُقصد بالمعلومات والمنشورات أن تكون، أو تشكل، أي نصيحة مالية أو استثمارية أو تجارية أو أنواع أخرى من النصائح أو التوصيات المقدمة أو المعتمدة من TradingView. اقرأ المزيد في شروط الاستخدام.
إخلاء المسؤولية
لا يُقصد بالمعلومات والمنشورات أن تكون، أو تشكل، أي نصيحة مالية أو استثمارية أو تجارية أو أنواع أخرى من النصائح أو التوصيات المقدمة أو المعتمدة من TradingView. اقرأ المزيد في شروط الاستخدام.