
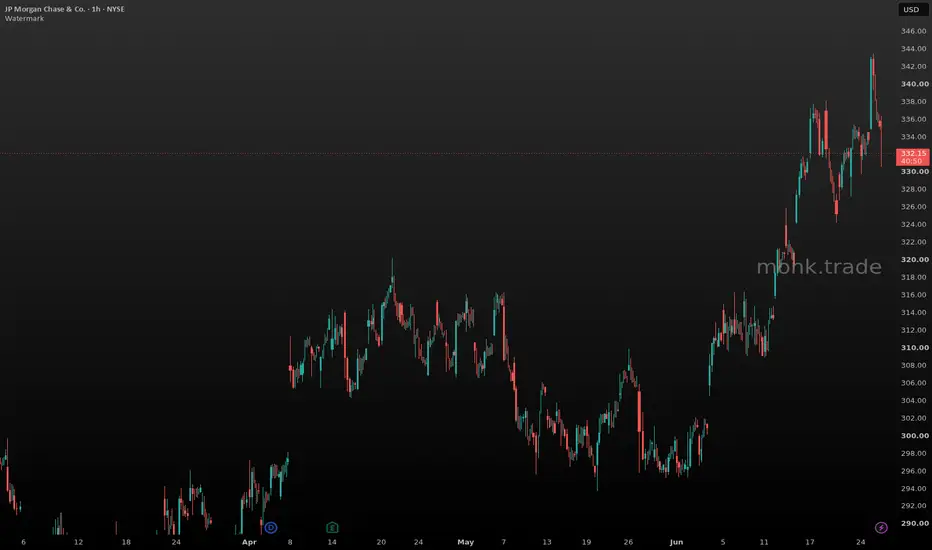
JPM on the 4-hour chart has been in a clean uptrend since the late-May lows near 295, printing a series of higher highs and higher lows that culminated in an all-time high near 343 on June 25. That ATH was followed by a two-day pullback that has brought price back to the 330–331 zone, which is the prior breakout shelf from the June 16–17 thrust and sits near the 4h demand that launched the last impulsive leg. The pullback is orderly — declining volume, no aggressive distribution — consistent with a healthy retest of broken resistance now acting as support.
On the 1-hour chart, the June 26 pre-market bar dropped from 336 to 330.70 on a single candle before stabilizing; the current ask at 331.15 represents price sitting right at that intraday low retest and the prior 330–331 consolidation cluster. A buy near 331.15 enters as price tests the absorbed demand zone. The stop at 328.50 is placed beneath the June 22 swing low (328.00) and gives roughly one ATR of breathing room below the entry — a close there would signal the pullback has extended beyond the healthy zone and into a potential structure break. The target at 340 is the first significant supply reference: the June 17–18 highs and the zone just below the all-time high at 343; placing the target at 340 avoids assuming a fresh ATH break, which is a separate unproven thesis. The reward of roughly 8.85 points outweighs the risk of 2.65 points meaningfully.
Fundamentally, the June 25 catalyst set is unusually strong: the Fed stress-test pass, a $50 billion buyback starting July 1 (providing active bid support within days), and a 10% dividend raise all anchor institutional demand. Leadership succession risk has been reduced with the Co-President appointments and Dimon staying roughly three more years. The market regime leans short broadly, which is a modest headwind, but JPM's stock-specific catalyst stack is first-party and regulatory-grade — sufficient to override a neutral-to-bearish tape on a blue-chip name with active buyback support imminent. Earnings are 18 days out and are not inside this swing's expected resolution window; they do not veto the trade but warrant position sizing discipline.
For options, the IV backdrop is unknown from the chain data, so a defined-risk vertical spread is the default structure. A 330/340 call spread expiring July 17 captures the expected move to the 340 target within a 21-day window that pre-dates earnings on July 14 — note that the July 17 expiry falls just after the July 14 earnings date, meaning the spread will capture any earnings reaction; if single-name earnings vol is elevated going into that date, the spread structure efficiently caps premium outlay versus a naked long call. Buying the 330 call and selling the 340 call defines both the maximum gain (the full spread width less net debit) and maximum loss (the net debit), with a breakeven near the entry price. A second structure using the July 10 expiry (pre-earnings) at the same 330/340 strikes offers a cleaner pre-catalyst trade with lower premium and tighter time constraint.
📍 Entry: 331.15
🛑 Stop: 328.50
🎯 Target: 340.00
⚖️ R:R: 3.34
On the 1-hour chart, the June 26 pre-market bar dropped from 336 to 330.70 on a single candle before stabilizing; the current ask at 331.15 represents price sitting right at that intraday low retest and the prior 330–331 consolidation cluster. A buy near 331.15 enters as price tests the absorbed demand zone. The stop at 328.50 is placed beneath the June 22 swing low (328.00) and gives roughly one ATR of breathing room below the entry — a close there would signal the pullback has extended beyond the healthy zone and into a potential structure break. The target at 340 is the first significant supply reference: the June 17–18 highs and the zone just below the all-time high at 343; placing the target at 340 avoids assuming a fresh ATH break, which is a separate unproven thesis. The reward of roughly 8.85 points outweighs the risk of 2.65 points meaningfully.
Fundamentally, the June 25 catalyst set is unusually strong: the Fed stress-test pass, a $50 billion buyback starting July 1 (providing active bid support within days), and a 10% dividend raise all anchor institutional demand. Leadership succession risk has been reduced with the Co-President appointments and Dimon staying roughly three more years. The market regime leans short broadly, which is a modest headwind, but JPM's stock-specific catalyst stack is first-party and regulatory-grade — sufficient to override a neutral-to-bearish tape on a blue-chip name with active buyback support imminent. Earnings are 18 days out and are not inside this swing's expected resolution window; they do not veto the trade but warrant position sizing discipline.
For options, the IV backdrop is unknown from the chain data, so a defined-risk vertical spread is the default structure. A 330/340 call spread expiring July 17 captures the expected move to the 340 target within a 21-day window that pre-dates earnings on July 14 — note that the July 17 expiry falls just after the July 14 earnings date, meaning the spread will capture any earnings reaction; if single-name earnings vol is elevated going into that date, the spread structure efficiently caps premium outlay versus a naked long call. Buying the 330 call and selling the 340 call defines both the maximum gain (the full spread width less net debit) and maximum loss (the net debit), with a breakeven near the entry price. A second structure using the July 10 expiry (pre-earnings) at the same 330/340 strikes offers a cleaner pre-catalyst trade with lower premium and tighter time constraint.
📍 Entry: 331.15
🛑 Stop: 328.50
🎯 Target: 340.00
⚖️ R:R: 3.34

monk.trade — Trade setups and market intelligence
إخلاء المسؤولية
لا يُقصد بالمعلومات والمنشورات أن تكون، أو تشكل، أي نصيحة مالية أو استثمارية أو تجارية أو أنواع أخرى من النصائح أو التوصيات المقدمة أو المعتمدة من TradingView. اقرأ المزيد في شروط الاستخدام.
monk.trade — Trade setups and market intelligence
إخلاء المسؤولية
لا يُقصد بالمعلومات والمنشورات أن تكون، أو تشكل، أي نصيحة مالية أو استثمارية أو تجارية أو أنواع أخرى من النصائح أو التوصيات المقدمة أو المعتمدة من TradingView. اقرأ المزيد في شروط الاستخدام.